Blog Archives

Is the beef industry sustainable: A look at grass-fed, hormones, growth promotants, and more
Lindsay does a great job of summarizing highlights from Dr. Jude Capper’s presentation at our Sensitive Issues Media and Communication training.
Recently, several of my colleagues and I hosted a Sensitive Issues: Media and Communication Training, we worked on developing and improving our communication skills around agriculture and agricultural topics. One of the topics we received more information on was sustainability.
Dr. Jude Capper, a livestock sustainability consultant, was our first speaker. I want to share with some of the messages about sustainability shared by Dr. Capper.
 – Sustainability is defined as “able to last or continue for a long time.” Many livestock farmers and ranchers are sustainable – whether they raise 10 head or 1,000 head. If you have never heard of the Century Farms Program, you should check it out. The American Farm Bureau Foundation recognizes farms or ranches by state that have been in a family for 100+ years! That is sustainable.
– There are essentially three things that need to be considered to be…
View original post 657 more words
Sensitive Issues Training-Engage
Many of us have been there…we’ve been asked a question in which the answer can be deemed controversial because the topic is based on emotion and beliefs. How do we respond? Do we get caught up in the emotion and passion of the issue and try to force our beliefs on others? Do we shy away or try to avoid an answer altogether by remaining silent?
Last week’s Sensitive Issues Media and Communications Training was developed to help all of us through these situations. It was a remarkable experience working with an amazing group of ladies, all passionate about food, but looking at food from a variety of perspectives and taking an issues-based approach in developing our team. Our team was comprised of a livestock expert, a manure expert, two food and nutrition experts, a communication’s expert, and myself from a crop production perspective. Special thanks to Dr. Chuck Hibberd, Nebraska Extension Dean and Director, for providing us a New Audiences Innovation Grant to partially fund this training. You can catch the conversation on Twitter at #SIMCT15.
We invited the Center for Food Integrity to conduct their Engage training with us, which was sponsored by the United Soybean Board. This training uses “the power of shared values to highlight industry trends and teaches strategies for using values-based messaging in daily conversations, and public speaking and media opportunities.” There was discussion, role playing, and mock media interviews. The training challenged me to use something I also just learned from “7 Habits of Highly Effective People” training….Seek first to Understand, then to be Understood.
Essentially, ask questions. Understand why a consumer believes X, Y, or Z about food and agriculture. Universal values include:
- Compassion
- Responsibility
- Respect
- Fairness
- Truth
Seek to understand the other person’s values by listening and asking questions. Then share by communicating about common values telling your food and ag story. We can’t really script this. We can’t be so vague that we’re not credible. For example, the following is vague and perhaps over-used:
By doing X we help the environment.
Instead, we need to be willing to talk about the hard issues with authentic transparency…to share our own individual stories.
I also desire water that is safe for my family to drink and desire for there to be enough water for future generations. That’s why my colleagues and I work with farmers to use research-based irrigation scheduling tools. Doing so helps reduce over-irrigation which can reduce the nitrate levels reaching our groundwater and the amount of water being pumped from the aquifer.
There were a few surprises for me. The first being the progress in one year (based on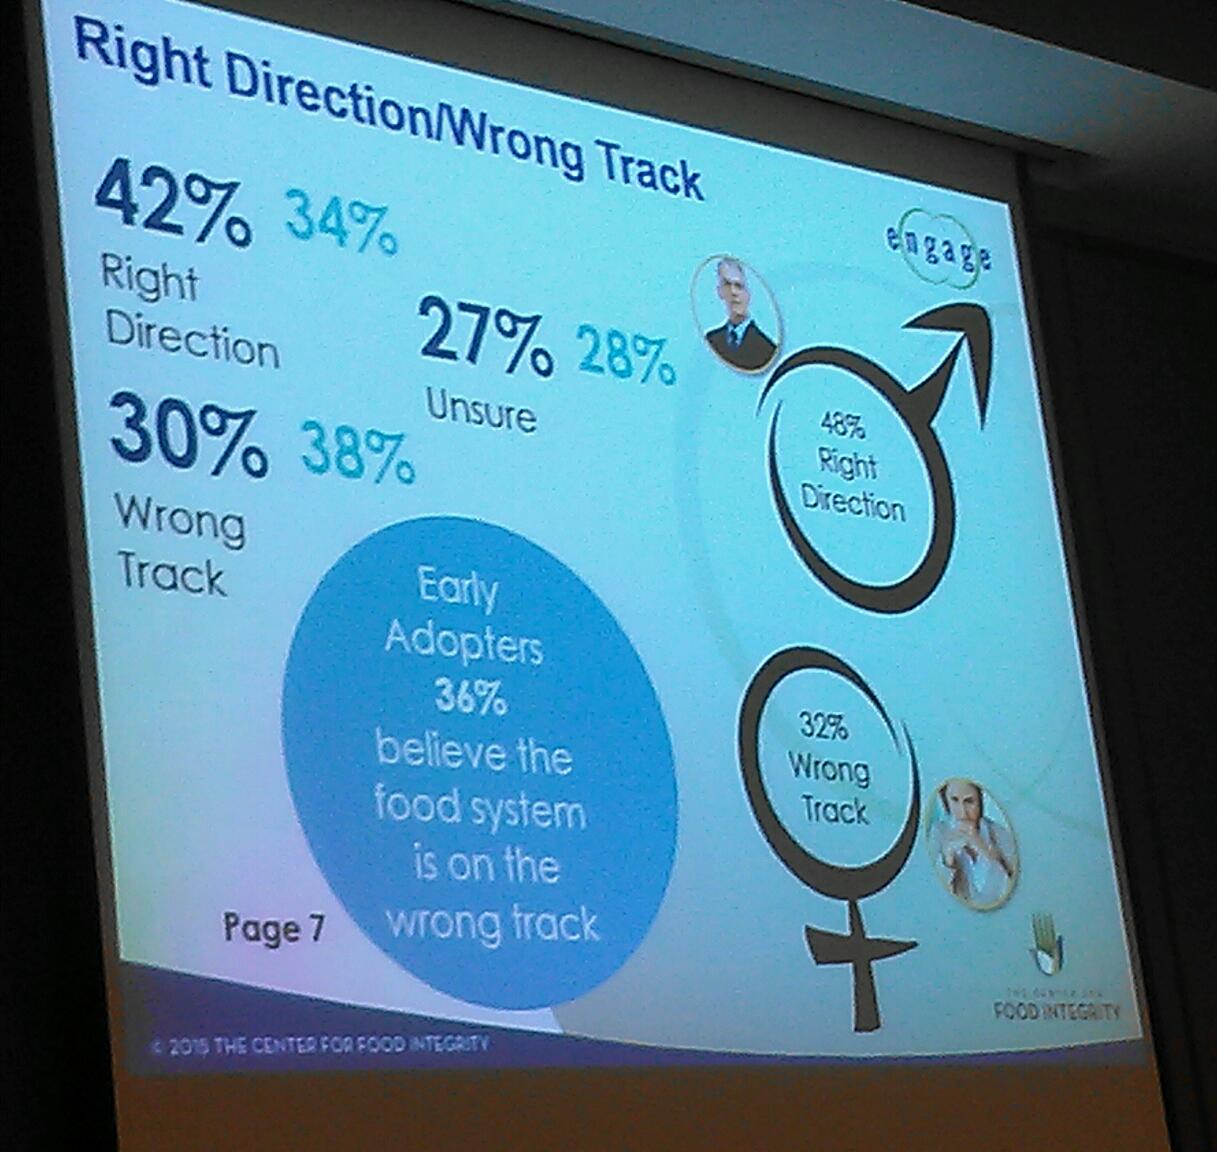 the Center for Food Integrity’s research) that we’ve made in consumer trust. This slide is essentially saying that 42% of consumers feel the food system is going the right direction (up from 34% last year). Men are more trusting of the food system at 48% believing the food system is on the right track. 32% of women feel the food system is on the wrong track.
Another surprising, yet encouraging piece of information for  me to see is which people are trusted the most on sensitive topics. On the topic of genetically modified foods, University Scientists topped the list, a Scientist that was a Mom was second, and Farmers were third. This is different than other research I’d seen, so I was excited about this. It was a survey of 2005 individuals conducted in 2014 and was encouraging from the standpoint that we do still have an opportunity to share our stories with those who truly desire to know more about where their food comes from. We will never change the activists, but we can reach the middle.
Finally, I loved the following quote which is so true:
A picture is worth 1000 words; a video is a library.
They showed the following video from Similac entitled, “The Mother ‘Hood“. Instantly, my mind went to how easy it would be for ag to do something similar. We tend to be so divided, but division is killing us. We are in the business of providing a safe, affordable, food supply to the world…but beyond that, our diversity provides consumer choice. If you watch the video, consider what is the common issue that could bring all of ag together. I have some ideas and my team members and I have discussed what a similar video with diverse agriculture groups would look like. What are your thoughts and ideas?
Vegetable Gardening Workshop
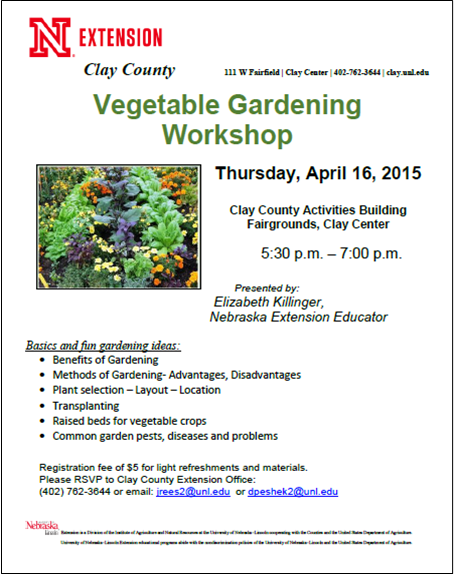
Have you been interested in starting your own garden? Have you been vegetable gardening for years but are curious about the latest trends and ways to raise vegetables? Do you have a particular pest or disease that continues to plaque your garden produce? Then this Thursday’s (April 16th) Clay County Vegetable Gardening workshop is for you! Join us for an enjoyable evening of learning and fellowship. There is a $5 fee to cover light refreshments and materials….and as always, plants will be the doorprizes 🙂 Please RSVP to jrees2@unl.edu or (402) 762-3644. See you there!
2015 Nebraska Ag Water Mgmt Network Meeting

April 2, 2015 is the date for the 2nd annual Nebraska Ag Water Management Network (NAWMN) Meeting! Come hear the latest in irrigation research and share with your peers during the innovation sharing and Q/A discussions. There’s no charge but please RSVP to Gary Zoubek at (402) 362-5508 or gary.zoubek@unl.edu.
National Ag Day!
Happy National Ag Day today on March 18th! Actually, this whole week we celebrate National Ag Week in which we recognize and celebrate the abundance provided by agriculture. We’re thankful for all our farmers and ranchers and all involved in the ag industry for providing a safe, affordable, and healthy food supply!

Your breakfast today courtesy of our Nations’ Farmers and Ranchers! Special thanks to Nathan Mueller, Nebraska Extension Educator in Dodge County, for this infographic.
There are several celebrations this time of year for Ag Week and Ag Day. Raising Nebraska in Grand Island is hosting an Ag Day Open House on Saturday, March 21, 2015 from 10:00 am to 1:00 pm. This is a free event open for the public.
Guests will enjoy interactive engagement stations that allow participants to learn more about agriculture through an activity, getting their questions answered, and feeling excited about Nebraska agriculture. From science and innovation, to community and culture, and even the global economy, Nebraska’s agricultural experience touches everyone. Through this incredible 25,000-foot interactive exhibit, you actually become part of it – in ways you never imagined and that you’ll never forget. Raising Nebraska is located in the Nebraska Building on the Nebraska State Fairgrounds at 501 E Fonner Park Rd, Grand Island, NE 68801. For more information on Raising Nebraska, visit www.raisingnebraska.net.
Precision Ag Data Management Workshop

There’s still time to register for the Precision Ag Data Management Workshop to be held in Clay Center next week! You are welcome to bring your own computer, but computers with the software will also be provided. Clicking on the image makes this flyer easier to read. Hope to see you there!
Nebraska On-Farm Research Updates

Another one of my favorite winter meetings, and honestly, one of the most powerful farmer learning experiences I have the opportunity to take part in, is the Nebraska On-Farm Research Network and the winter Updates! Why is this such a powerful experience? Because the farmers who conduct the research are the ones presenting what they did, why they did it, and their results! The discussion amongst farmers, ag industry, and Extension is highly engaging and thought provoking. Great questions are asked. But even more powerful is the understanding that occurs on what valid research is and how to question what one sees and hears presented at meetings, in magazines, and online. The Nebraska On-Farm Research Network is sponsored by the Nebraska Corn Board and Nebraska Soybean Board via your checkoff dollars and this year we are having meetings at three locations in the State. February 13th will be at College Park in Grand Island; February 16th at the Lifelong Learning Center in Norfolk; February 17th at the ARDC near Mead and all meetings will begin at 9:00 a.m. and last till 3:00 p.m. There is no charge for these meetings but pre-registration is needed for meal count and ensuring we have enough materials and space. Please pre-register for all meeting locations by calling (402) 624-8000 or email christina.franklin@unl.edu. There are five CCA credits pending approval. Hope to see you at one or more of the meetings!
Simplification and Accuracy in Texas A&M Farm Bill Decision Tool
As I work with producers and landlords, I’ve seen a variety of understanding and preparation for inputting information into the Texas A&M Farm Bill Decision Tool. Previous blog posts have shared screenshots for inputting information. What I will do with this blog post is share how to simplify the time spent inputting information while checking for accuracy of the information inputted. You will only receive as accurate of information as what you input into the tool!

First, your best friend while inputting is the “eraser sheet” from FSA. It lists CC yields, base acres, reallocated base, but best yet, it lists planted production by year from 2009-2012. That seems to be the largest hang-up I have with producers and getting information to turn out correctly. RMA acre data often includes additional acres that were once pasture or CRP that are now in production but not accounted for in your base acres with FSA. So you have to use FSA production acres in this tool for the information to come out correctly for your farms. It also is a life-saver for farms that are joined together or split out….takes the headache out of figuring planted acres in those years! Note: The above eraser sheet is just an example so you know what one looks like. It is NOT used for inputting or double checking in the next several screen shots.

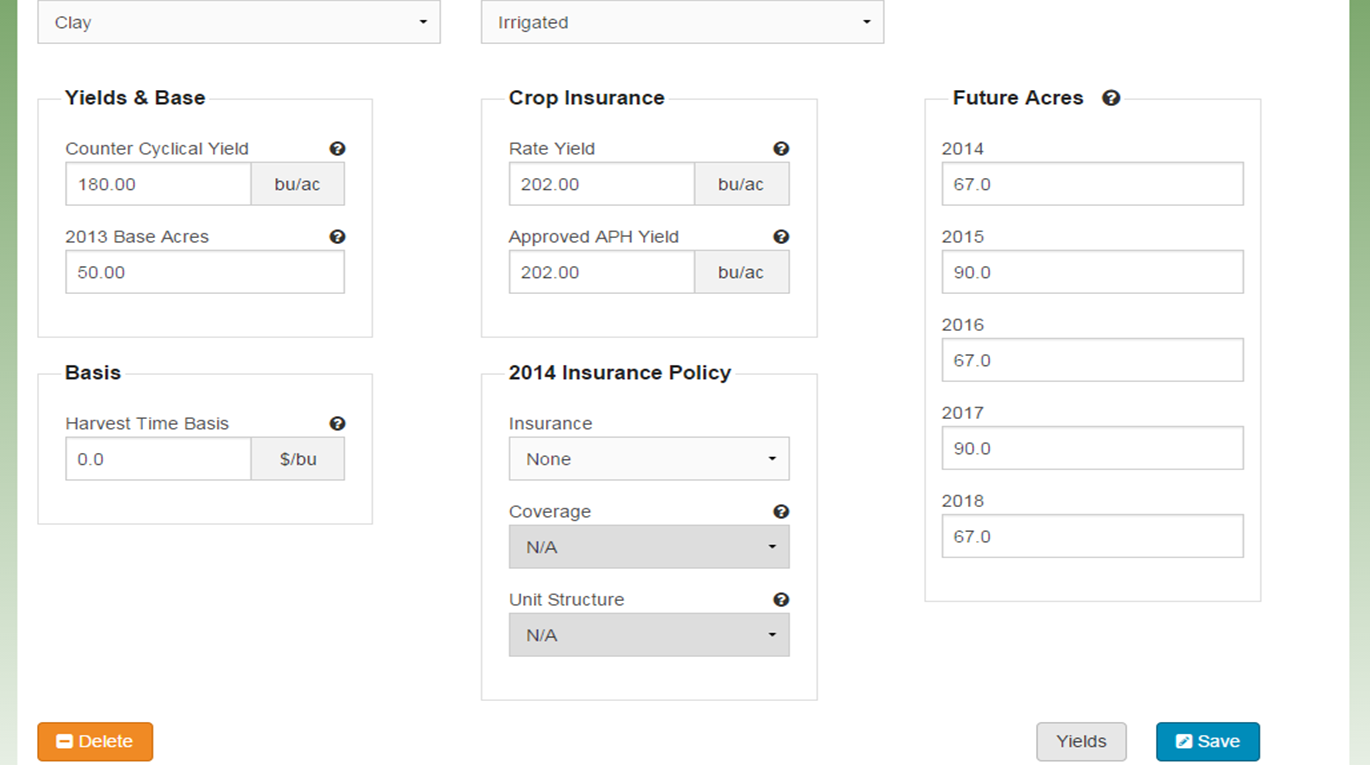
On the “edit” page when entering a farm unit, at the top of the page, you don’t need a description, but can add one if you wish. To simplify and save time on the bottom half of the page: ONLY entering CC yield and base acres for the specific crop saves a great deal of time. You don’t need basis, crop insurance, or insurance policy if you ARE NOT using this tool to make a crop insurance decision. You also only need “future acres” if you are interested in looking at crop insurance, or if you are interested in evaluating ARC-IC as an option. Inputting “0” for future acres just provides a summary of ARC-Co vs. PLC payment projections. Then press “save”.
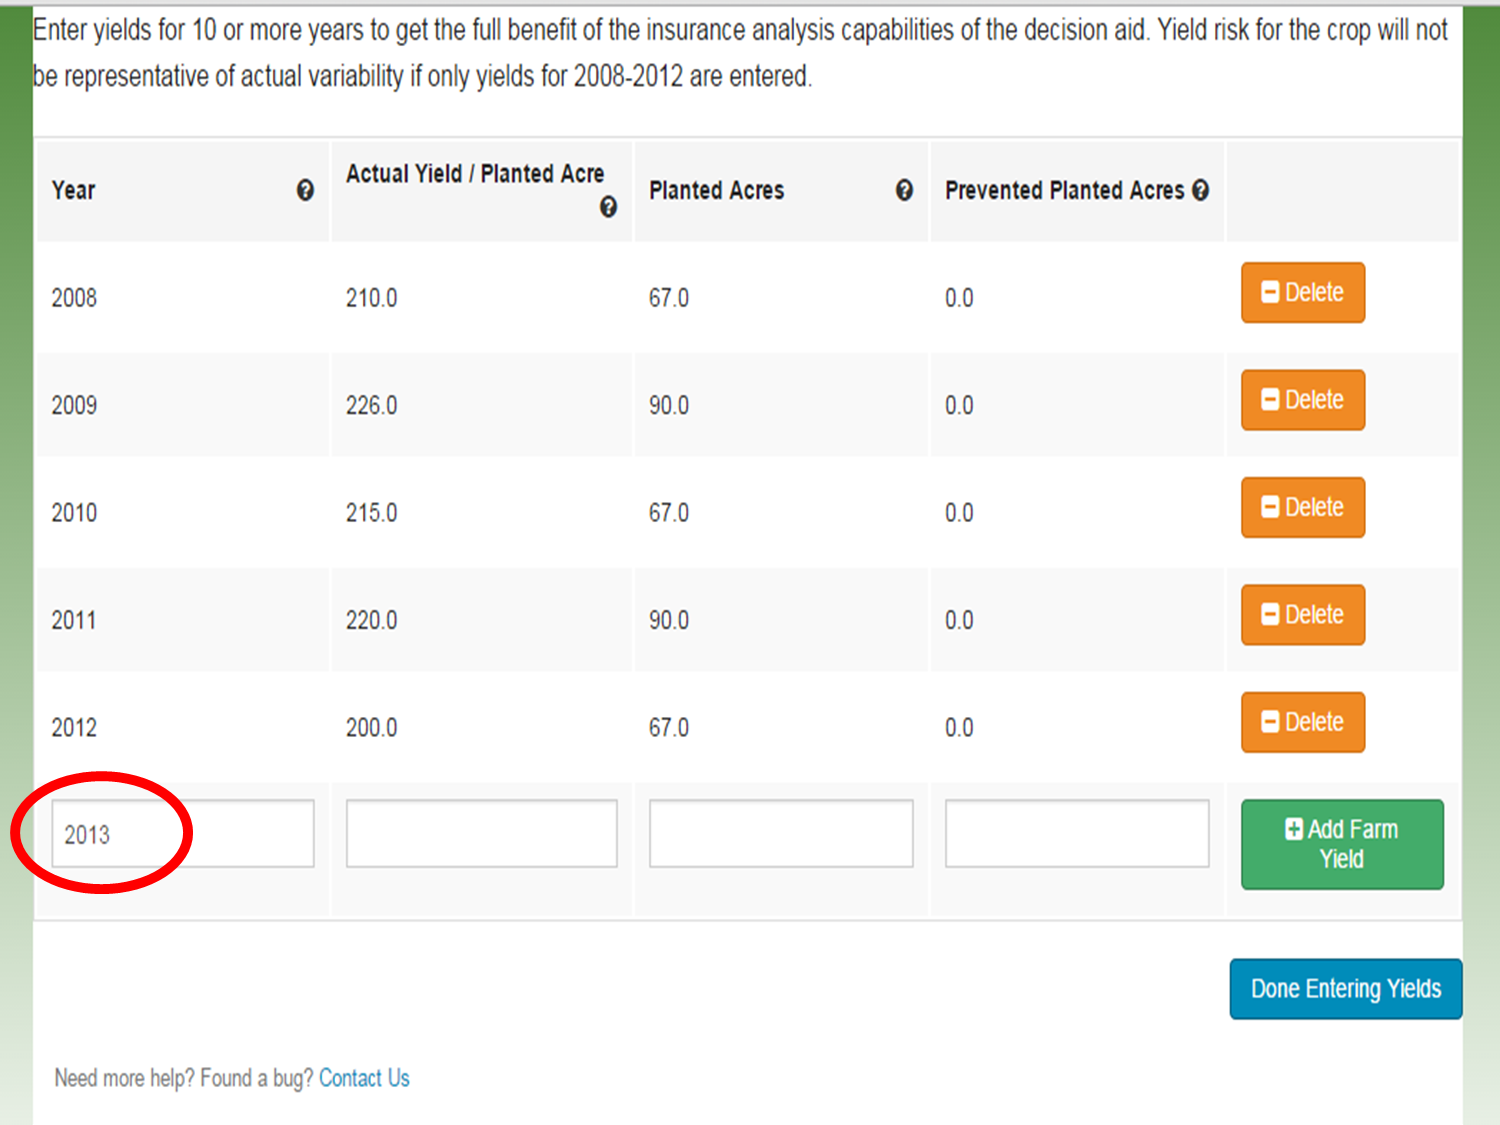
When entering yields, you need to enter one more date after all your yield data has been entered for the data to save properly. In this example, I have inputted yield data for 2008-2012. I then added “2013” and pressed “save yield data”. Not doing this step will delete your last row of yield information. On “planted acres” use production acres from FSA vs. RMA as this provides the correct acres for base reallocation decision and thus, correct potential payments based on those acres. 2008-2012 is necessary to determine updated yield. 2009-2012 acres are needed for determining base reallocation. The acres for 2008 will not influence or throw off the acres in this tool.

For crops in which you have old base acres but you have not produced since 2008, you can enter yields by adding a “0” in them as shown here. This does take time, so you can also skip this step as shown in the next screen shot without affecting your analysis.

UPDATE: If you wish to save additional time, you DON’T have to enter in “0” for yields for old base acre crops you didn’t plant from 2009-2012. Instead, on the home screen, simply hit “save” after entering in old base acres and CC yield for crops you no longer plant and skip entering yields for these crops. The output is the same (Thanks to Randy Pryor, Nebraska Educator in Saline County for this time-saving tip!)

Once all your crop information is entered for every one of your farms, you need to double check your data. First, Click on the “Yield Update” decision tool. The first screen shows what you entered and gives you a chance to check your information. Double check that your CC yields are entered correctly and that the yields look correct for what was entered. If the information is correct, then click on the “information is correct” button. If it is not, click on “home” and go back to the crop and farm where the information needs to be corrected. Note that if you had a crop that did not have CC yield on your FSA sheet because you also had no old base acres for that crop, on the “Home” screen enter “0” for CC yield and “0” for base acres. Then the County plug yield is inserted as the CC yield on this screen.

You will then see the yield updates for all your crops on all your farms that you inputted. You can print this screen for your information. A couple things to look for on this sheet. Whenever the 2013 CC Yield is higher than PLC Yield, it’s probably wise not to change that yield. Also a note for corn in particular, I like to go through all the farms and highlight the farm with the highest PLC corn yield. When having difficulty making a decision between ARC-Co vs. PLC, crops with highest PLC yields will offer the best PLC payments.

Next it’s time to look at the “base reallocation decision tool”. The first screen is a double check for you. It’s very important that the current base acres and reallocation acres match what was given you by the FSA office. Not inputting production acres based on FSA records (shown in top table) can throw off the potential base reallocation in the lower table. If the current base and potential reallocation base agrees with what was provided from FSA, simply push the “information is correct” button. If it doesn’t match, you will need to go back to the home screen and change the production acres so that the total production matches up to total base acres each year from 2009-2012 in order for the base reallocation to be correct. One more note: If you have split irrigated and non-irrigated acres, make sure to take a % of base acres assigned to the crop. (Ex. This farm has a total of 50 corn base acres. If 50% your acres are irrigated corn and you were in a county with split irrigated/non-irrigated opportunity, then assign 25 base acres to irrigated corn on the home screen and 25 base acres to non-irrigated corn). Inputting 50 corn base acres for both irrigated corn and non-irrigated corn would give you a total of 100 base acres which is 50 acres too many and will provide incorrect information.

Next you have an opportunity to select prices. I typically select USDA prices for all crops first. Then hit the “analyze” button. When the following screen appears, I click “download” then print the PDF that appears one-sided. This ensures that information for each farm number does not end up back to back with another farm number if you print two-sided. I then scroll to the bottom of this page, click “change prices” and click all the FAPRI prices, analyze, download, and print one-sided again. It does take some paper, but you’ll see why I recommend this shortly. It also allows you to keep farms separate if you’re showing results to landlords and/or tenants.
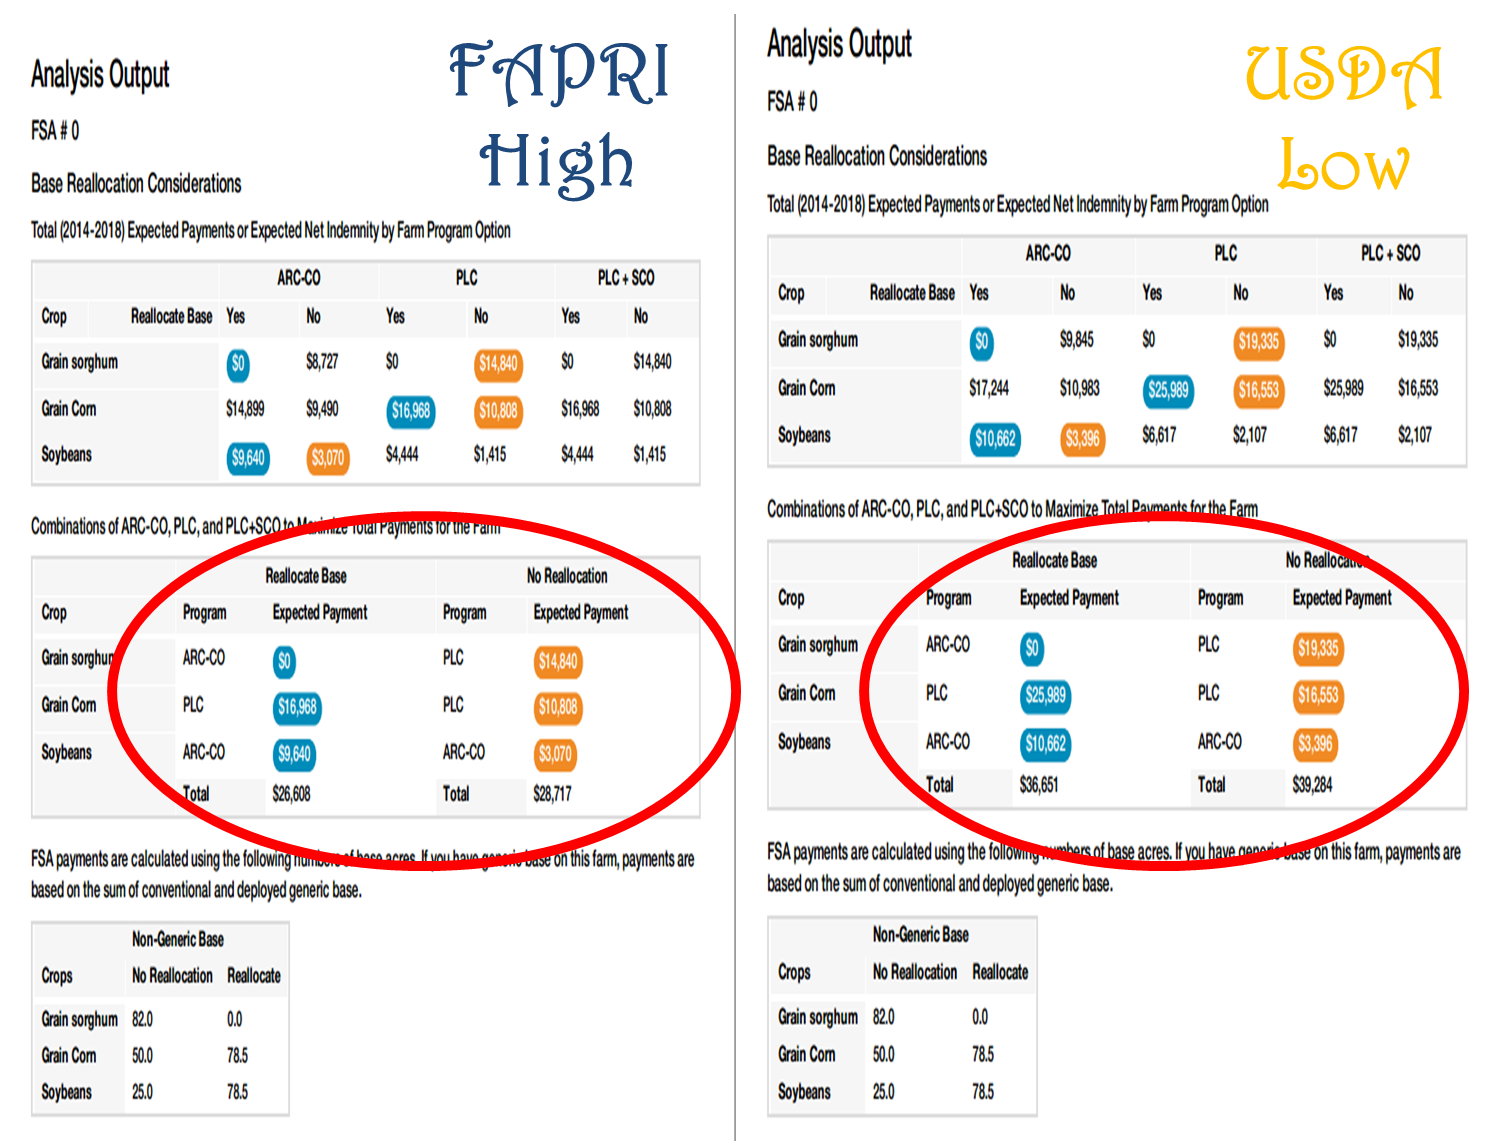
Once I print both sets of prices, the gals in my office and I staple together each farm number. We write “high” for FAPRI prices and “low” for USDA prices. I then place the High and Low together by farm number and farm by farm, go through the output with the farmers. Ultimately, I’m looking for trends when both the higher and lower prices agree. In this example, we are first looking at the base acre reallocation decision. Blue bubbles mean higher payments with reallocation; orange means higher payments without reallocation. Look at the bottom line for total payments. Notice in this example that for both low and higher prices, not reallocating the base is consistently higher. To help explain this, look at the base acre information below. What is occurring for this particular farm is a loss of grain base from 132 to 78.5 grain base acres. So essentially for this farm, the increase in corn base acres was not enough to off-set the milo payment from old base. The farmer then has to choose if he/she wants to reallocate base to what is currently planted, or retain base acres to protect grain base and obtain the milo payment. The other thing to notice is the decision of ARC-Co or PLC for each crop and how well they match between high and low prices. In this case, if the farmer chooses no reallocation, PLC is most consistent for milo and corn while ARC-Co is most consistent for soybeans. When both high and lower prices agree like this, it helps make decisions easier. You can always go back and play with the prices more, but you have to be careful with that. Remember, your decision ultimately is based on what you feel future prices will be for the next five years.
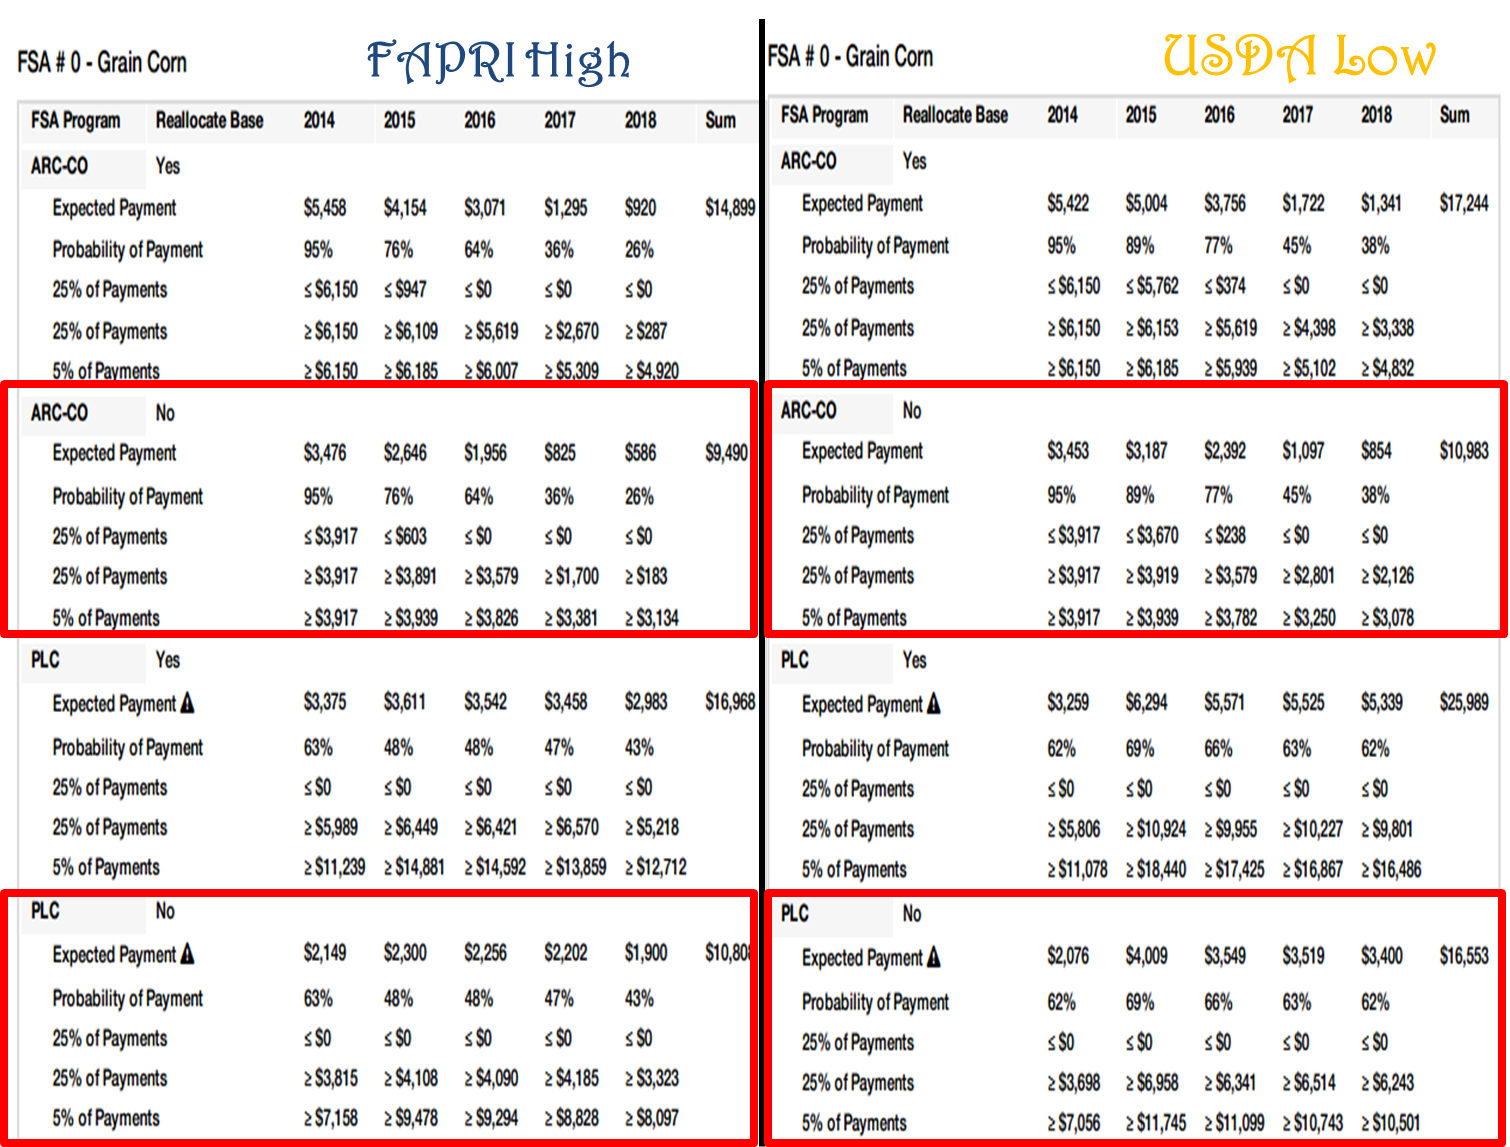
The final thing I like to do is analyze the output for higher and lower prices crop by crop, especially for farms where Corn switches decisions on the first page from ARC-Co with FAPRI prices to PLC with USDA prices. It comes down to what the producer feels prices will be the next 5 years. I compare the ARC-Co vs. PLC prices for whichever decision the farmer makes regarding base reallocation. In this example, let’s say the farmer decides to not reallocate his/her acres. We then compare ARC-Co vs. PLC for both FAPRI and USDA prices for each crop. Besides the total payment over the length of the farm bill based on these prices, I also like to compare payments year by year with both options and look at probabilities of those payments based on the projected FAPRI and USDA prices. In this situation, PLC provides higher payments in both higher and lower price situations over the life of the farm bill. ARC-Co provides slightly larger payments the first one or two years depending on price. One thing to keep in mind: If FAPRI prices are correct, then the PLC payments for years 2015-2018 go to $0 because FAPRI is estimating prices above the $3.70 trigger price for corn. So why does the tool show a PLC payment for FAPRI prices? It is taking into account 500 scenarios at one time that all have a chance of occurring in the future and the probability of payment if prices are at, above, or below the predicted FAPRI price for each year. Same for USDA prices. So it’s important to always keep this in mind when analyzing the results.
Hopefully this post was helpful to you in understanding how to simplify your input into this tool, to understand the importance of accuracy, and to understand one way of analyzing data from the Texas A&M Decision tool! You can view more information by checking out these YouTube videos.
Additional Farm Bill Decision Tool Information
I’ve really enjoyed working with producers and landlords on looking at farm bill decisions for individual operations. A quick caution again regarding supplemental coverage option (SCO), you can only take price loss coverage (PLC) into account not PLC+SCO if you haven’t plugged the information into the Texas A&M farm bill tool correctly (meaning 10 years of yield data and all production information broken into crop insurance units for each FSA farm number). You can always discuss SCO with your crop insurance agent but the tool itself won’t provide correct output without inputting numbers correctly. You can simply remove SCO from the tool information by not selecting a crop insurance option on the first home screen of each farm unit you input into the Texas A&M tool. I have screen shots with additional information in this blog post.
I’m willing to work individually with those interested in looking at the Texas A&M tool for your decisions. Please call (402) 762-3644 to set up an appointment. You will need to bring the following with you:
- Your CC yields from FSA (the ones sent in July/August tend to have all your CC yields for all your current base acres). You could also request your FSA 156-EZ form for this information. Or better yet, ask for FSA’s eraser sheet for each of your farms.
- Your base acres and potential base reallocation information FSA sent you.
- Yield production history from 2008-2012 by crop. If you were in the ACRE program during the last farm bill, please also ask them for the screenshot of all your yield production history. Since you had to prove yields with that program, your production information is already in their system. If you weren’t in ACRE, you will need to fill out the price loss coverage form FSA sent you. You can obtain this information from your crop insurance records or from scale tickets by farm if you don’t have crop insurance information. You will not have to prove yields at the time of signing up, but please keep your records as you will need to prove how you obtained this information in the event you are spot-checked. Here’s more information regarding yields.
When determining your yield history from 2008-2012, for combined counties, FSA is looking for a total combined production (not a weighted production based on irrigated vs. dryland acres). If you have crop insurance information, add up the total production in bushels for irrigated and dryland by crop (ex. Corn) for each FSA farm number and total the acres of each production entry. Then divide production by total acres to determine your yield. It’s important you use RMA production data, not APH yield as the APH yield may incorporate other modifications to actual production.
For split counties, I’ve been recommending to keep dryland and irrigated production split on the top part of the FSA PLC form and then the combined yields at the bottom part of the form. This allows you to have the split yield information for the Farm Bill Decision Tool and also the combined yield data that FSA needs. Add up dryland production by FSA farm number and irrigated production by that farm number. When inputting data from a split county into the Texas A&M decision aid, you will need to allocate base acres on a percentage of the irrigated vs. dryland acres. For example, if 50% of the land in one FSA farm number is irrigated and you have 200 acres, then 100 acres would be used for the base acres in the decision tool for irrigated yields and 100 acres would be used in the tool for dryland yields. Your CC yield will remain the same for both irrigated and dryland by crop.
Inputting Data into Texas A&M Farm Bill Decision Tool
Last week was enjoyable working with farmers on Farm Bill decisions. I’ve decided to work with producers on an individual basis. If you are interested in help looking at your potential options using the Texas A&M model or would like another set of eyes to make sure the data was inputted correctly, please call (402) 762-3644 and Deanna or Holli will get you scheduled for a time.
One caveat is that this model is only as good as the data you input into it and your decisions
Example of FSA “eraser sheet” courtesy of Randy Pryor, Nebraska Extension in Saline County.
are based on where you feel potential prices the next five years will be. You need your CC yields and base acres from FSA as well as production history since at least 2008 (2003 if you wish to run crop insurance tool). Requesting a copy of the FSA “eraser sheet” is a great tool to check on planted and crop production planted acres and to see if reallocated base jives with the computer program. The Texas A&M simulation at https://usda.afpc.tamu.edu/ isn’t difficult to run, but it can be confusing as to what number to input where. Begin by registering at the site by providing an email address and password. Then login and you will see the following screen.
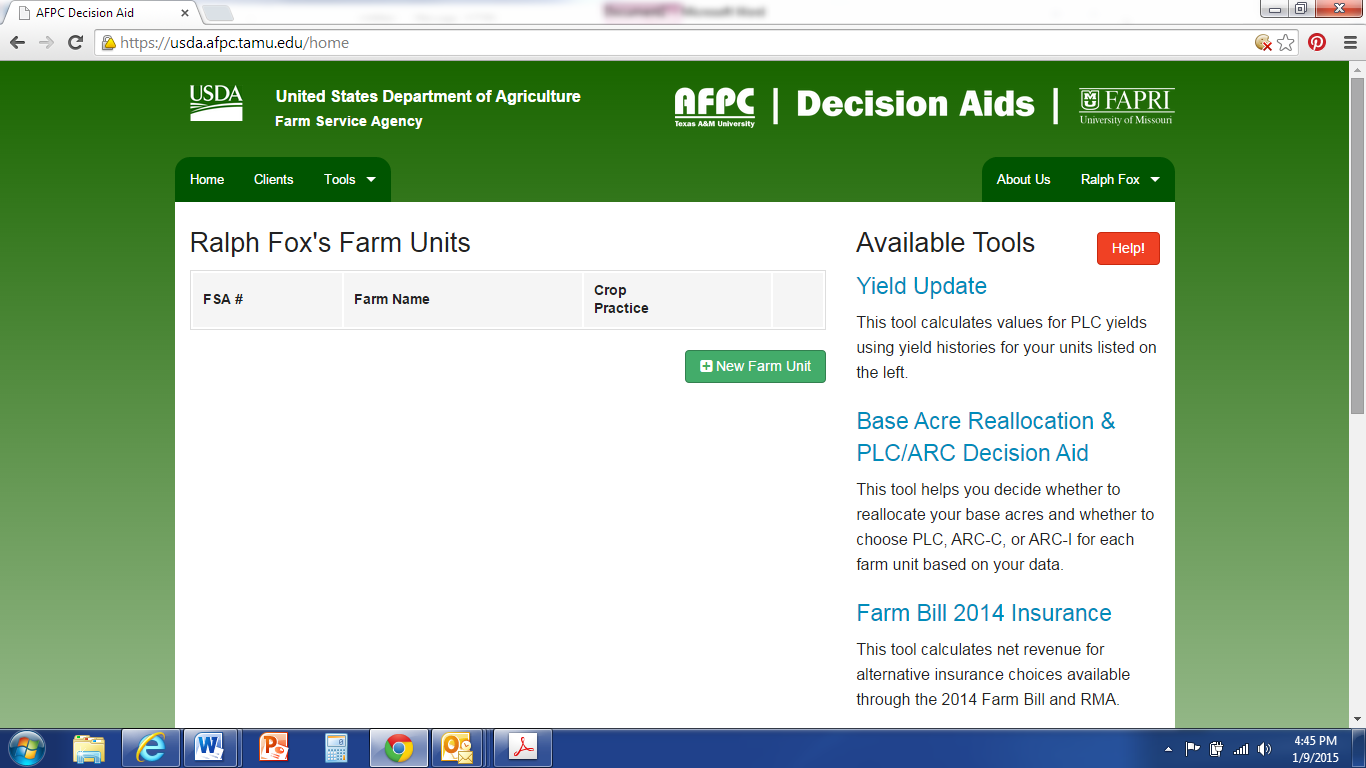
It is important for you to decide what you want the tool to analyze for you. It can analyze: yield update, base reallocation, ARC vs. PLC, and crop insurance (shown in right-hand column in screen-shot, or can also be selected from “Tools” in top drop-down menu). If you want to analyze crop insurance decisions, EACH crop insurance tract needs to be entered as a “new farm unit” under each FSA farm number. It takes a lot of time and it can be done, but that’s the only way to use this tool to also look at crop insurance including supplemental coverage option (SCO).
If you do not want to look at crop insurance decision but wish to consider the first three decisions, then for counties such as Clay County with COMBINED irrigated and dryland county yields, completing the Price Loss Coverage (PLC) Yield Worksheet (CCC-859) from FSA with your combined irrigated and dryland yields for each FSA number will greatly aid you in inputting the data. For counties with any splits in irrigated and dryland yields, I recommend placing irrigated and dryland production separately on the top of the PLC Yield worksheet, and then combining production by crop towards the bottom of the worksheet. Regardless of if your county has the opportunity for a split irrigated/non-irrigated payment, all CC yields in Nebraska are combined by crop (regardless of irrigation or not), so FSA will want a combined yield by crop on their form.
EACH crop needs to be entered as a separate farm unit. I have created a fake account to walk you through a simulation.
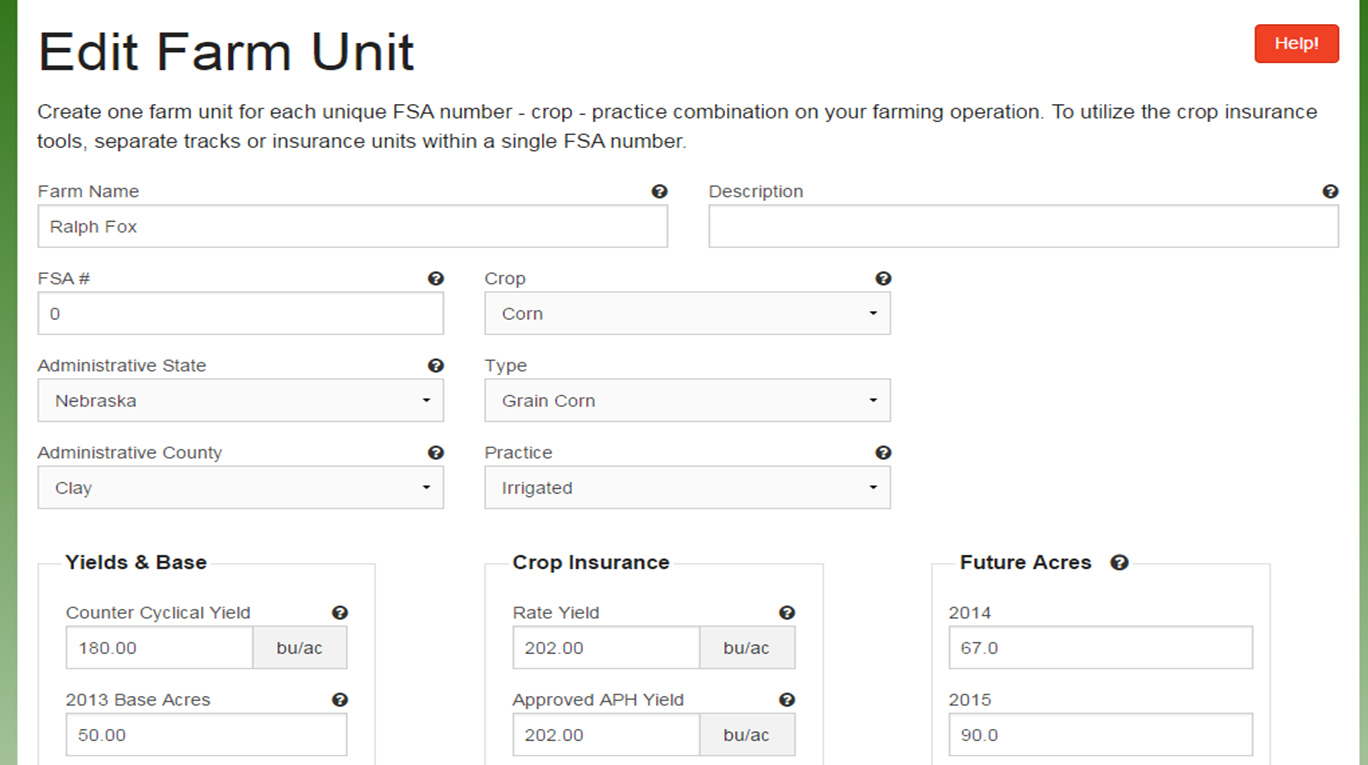
Some are having a difficult time finding “rate yield” on their crop insurance forms. It is not critical if you are not using the crop insurance tool and the same Approved APH yield can be inputted for the rate yield as well. If using the crop insurance tool, the correct rate yield from crop insurance must be used. UPDATE: If you ARE NOT interested in analyzing crop insurance information, “0” can be inserted for basis price, rate and APH yields, and select “none” for crop insurance. If you are also not interested in analyzing ARC-IC, then “future acres” can also be entered as “0”.
When entering yields, you need to enter one more date after all your yield data has been entered for the data to save properly. In this example, I have inputted yield data for 2008-2012. I then added “2013” and pressed “save yield data”. If you input 2013 yields, be sure to add a “2014” instead. Not doing this step will delete your last row of yield information.

Notice that each crop needs to be added as a separate farm unit. If using the crop insurance tool, each crop insurance tract under each FSA farm number needs to be added as a separate farm unit. Be sure to split out base acres among the tracts and be sure that the total base acres add up to the total base acres from FSA.
For entering separate crop insurance tracts, the CC yield should remain the same for all dryland tracts under one FSA farm number (same for irrigated). However, you will have to split out base acres amongst the tracts and you need to make sure the acres inputted add up; please double check this!
For your yield update and base reallocation information: For some of you, the base reallocation acres in the tool have been slightly different than what you received from FSA office. That may be because risk management agency (RMA) acres were used and were different than the production acres FSA had on file. You need to use the FSA acres for planted acres when using this model if they differ from the RMA ones.
When running this model, on many farms PLC + SCO looks favorable for some crops. A word of caution, you can consider PLC but should not consider SCO in your decision if you have not broken everything out into crop insurance tracts and included 10 years of production history into the tool. So in the decision of reallocating base acres or not, in the final summary section that gives you total numbers, anytime PLC+SCO is shown for a particular crop and you have not included the proper crop insurance info, you need to re-calculate the final total by hand using PLC ONLY from the table above that area. It normally doesn’t change the outcome that the decision tool provides, but it can. I’m not saying that SCO shouldn’t be considered, what I’m saying is that the numbers provided in the tool are not accurate if you have not inputted the data in the way needed to look at crop insurance decisions.

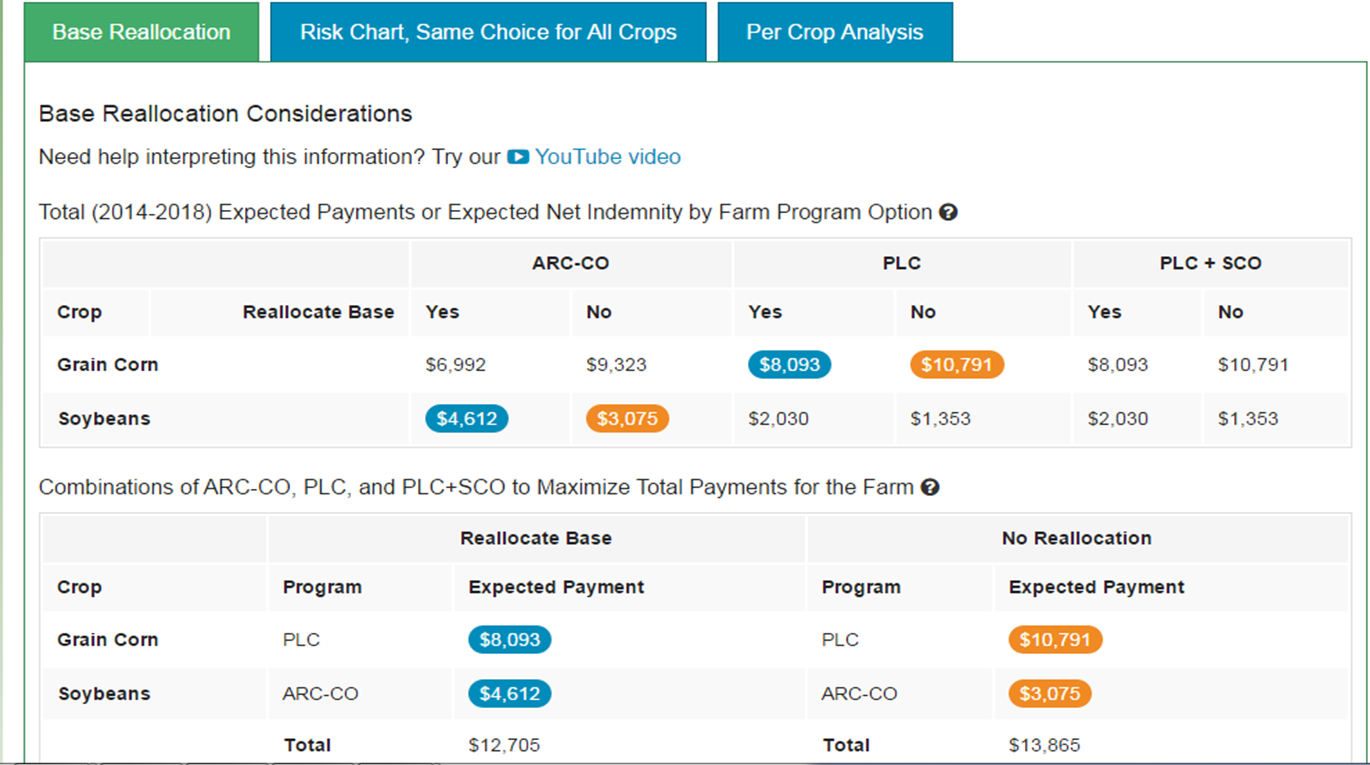
In this example, you notice three tabs: Base reallocation, risk chart, and per crop analysis. The green tab shows what you are looking at-in this case base reallocation. Notice there are two charts: The top one shows ARC-Co, PLC, and PLC+SCO. Blue circles indicate best option with reallocating base acres while orange circles indicate best option without reallocating base acres. The second table gives you your totals. Notice in this table and the one above that PLC+SCO are shown as the best options for corn. However, in the total, because we did not separate the crop insurance tracts in this FSA farm number and because I didn’t include 10 years of yield data, I need to recalculate the totals by looking at the top table for the next highest prices under ARC and PLC. So for this example, to refigure best reallocation of base payment total, I would take the $8093 listed in PLC, reallocation for corn since it is higher than ARC and add it to the $4612 for soybean payment to get: $12,705 for base reallocation. For no base reallocation, I would add $10,791 from PLC since higher than ARC in this example and add it to $3075 to get a total of $13,866 for no base reallocation. Most of the time, the outcome stays the same, but there are a couple instances it has changed, so wanted to make you aware of the importance of this.
Or to get around having to hand-calculate removing SCO from the total decisions, Randy Pryor and Paul Hay, Nebraska Extension in Saline and Gage Counties respectively, discovered that if you select “no crop insurance policy” on the edit screen for each farm unit, that it automatically takes out adding SCO into your final calculated options as you can see from the next screenshot!
When not adding crop insurance tract info and 10 year yield history information to be able to analyze Supplemental Coverage Option (SCO), removing crop insurance from the beginning edit screens allows you to analyze base reallocation and ARC-Co vs. PLC program options without having to recalculate and remove SCO. It won’t give you a higher SCO payment number when adding information in this way.
Some of you have questioned why PLC even lists a payment when prices are inputted higher than the benchmark price of $3.70 for corn, etc. The Texas A&M tool is giving you essentially a bell curve of 500 random outputs with the distribution of that curve around the particular price you input for each crop. So with every given price you input, there’s a certain probability that the price will be at, above, or below that particular price. That’s essentially what the red, green, yellow bars are showing you on the analysis. So you’re assessing where you feel prices will be, what decision will allow you to best sleep at night, the potential of spreading out risk with several farm numbers by choosing different options, etc. You can also view the YouTube videos from Texas A&M with more information!


