Monthly Archives: February 2015
Precision Ag Data Management Workshop

There’s still time to register for the Precision Ag Data Management Workshop to be held in Clay Center next week! You are welcome to bring your own computer, but computers with the software will also be provided. Clicking on the image makes this flyer easier to read. Hope to see you there!
Nebraska’s Advantage
This week, I’d like to share some information that came out in a white paper from the UNL  Agricultural Economics Department on the special relationship we have here in Nebraska between crops, livestock, and biofuel production capacity not found in other parts of the U.S. to the extent we have here. It’s called the “Nebraska Advantage”.
I think it’s important for all of ag industry to realize we need each other as it seems we sometimes forget how inter-dependent we are. Crop producers need the livestock and ethanol industries as they are a high percentage of our end users. Yet many times I hear of crop producers fighting livestock expansion or livestock coming into an area. The purpose of the white paper was to share the numbers of where Nebraska livestock, grain production, and ethanol production currently stands, and what Nebraska could gain if we worked to increase livestock production in-state where we have a wealth of resources with our crops, water, and biofuel production.
Nebraska currently ranks 1st in irrigated acres, 1st in commercial red meat production and is tied with Texas for cattle on feed, 2nd in corn-based ethanol production, 3rd in corn for grain production, 4th in soybean productions, 6th in all hogs and pigs, and 7th in commercial hog slaughter, and 9th in table egg layers. However, in reading this white paper, one quickly realizes we’re not taking advantage of the tremendous grain production capacity here in the State.
We export over 1/3 of our annual corn crop, at least half of the in-state production of distiller’s grains (a co-product from ethanol production that is fed to livestock), and more than 80% of our soybean meal output. Corn and soybean production have increased in our State by 50 and 25% respectively, which is a blessing due to our irrigation capacity. But increasing amounts of this grain are being shipped out-state instead of benefiting rural economies in Nebraska if it was used in-state for value-added livestock production and processing instead.
In the white paper, graphs are shown comparing Nebraska to neighboring states. These graphs show Nebraska lagging neighboring states in growth of the livestock industry. For example, while Nebraska overall increased in hog production, the inventory increased 17.2% during the first half of the decade, but declined 11.8% in the second half. In comparison, Iowa realized an increase of 31.5% within the decade. What was really interesting to me is the fact that Nebraska exports 2.5 million pigs annually to neighboring states to be finished and shipped back to Nebraska for processing, showing potential for growth in the market hog sector. The dairy sector has also declined in herd numbers in Nebraska compared to other states and Nebraska’s poultry industry (mostly egg laying hens) has declined over the past decade in spite of constant numbers across the U.S.
When one looks at Nebraska’s economy, cash receipts from all farm commodities totaled over $25.6 billion in 2012 and livestock/livestock product sales was 45% of this total ($11.6 billion). Increased employment, local tax revenue, value-added activity, and manure for fertilizer are all economic benefits of livestock expansion. The paper stated,
A base expansion scenario that includes a 25% increase in market hogs, a doubling of dairy cow numbers, a ten percent increase in fed cattle production and a tripling of egg production, along with the associated processing industries, has the potential to provide an additional 19,040 jobs, with labor income of almost $800 million and value-added activity of over $1.4 billion. This activity has the potential to generate over $38 million in local tax revenue. While this amounts to a fairly small percentage of Nebraska’s total economy, these impacts will occur almost entirely in non-metropolitan areas of the state and would be quite beneficial to rural economies.
Livestock development has been held back by various issues and policies including: limitations on corporate farming activity in Nebraska, state and local permitting processes, nuisance roles and lawsuits, and issues/concerns from the general public and interest groups. The final conclusion of the paper was that significant growth in employment and economic output throughout Nebraska is dependent upon these issues being overcome.
I would challenge all of us to keep an open mind when producers desire to diversify by including livestock in their operations or through livestock expansion. In many cases, doing so allows another person to come back to an operation, or allows someone to get started farming, which in the long run benefits our rural economies. It’s ok to ask questions, to become more educated. It’s through these questions that one learns how production practices have changed to ensure the health and welfare of our livestock and in odor reduction from the facility and manure application. You can read the entire white paper contents here.
Nebraska On-Farm Research Updates

Another one of my favorite winter meetings, and honestly, one of the most powerful farmer learning experiences I have the opportunity to take part in, is the Nebraska On-Farm Research Network and the winter Updates! Why is this such a powerful experience? Because the farmers who conduct the research are the ones presenting what they did, why they did it, and their results! The discussion amongst farmers, ag industry, and Extension is highly engaging and thought provoking. Great questions are asked. But even more powerful is the understanding that occurs on what valid research is and how to question what one sees and hears presented at meetings, in magazines, and online. The Nebraska On-Farm Research Network is sponsored by the Nebraska Corn Board and Nebraska Soybean Board via your checkoff dollars and this year we are having meetings at three locations in the State. February 13th will be at College Park in Grand Island; February 16th at the Lifelong Learning Center in Norfolk; February 17th at the ARDC near Mead and all meetings will begin at 9:00 a.m. and last till 3:00 p.m. There is no charge for these meetings but pre-registration is needed for meal count and ensuring we have enough materials and space. Please pre-register for all meeting locations by calling (402) 624-8000 or email christina.franklin@unl.edu. There are five CCA credits pending approval. Hope to see you at one or more of the meetings!
Simplification and Accuracy in Texas A&M Farm Bill Decision Tool
As I work with producers and landlords, I’ve seen a variety of understanding and preparation for inputting information into the Texas A&M Farm Bill Decision Tool. Previous blog posts have shared screenshots for inputting information. What I will do with this blog post is share how to simplify the time spent inputting information while checking for accuracy of the information inputted. You will only receive as accurate of information as what you input into the tool!

First, your best friend while inputting is the “eraser sheet” from FSA. It lists CC yields, base acres, reallocated base, but best yet, it lists planted production by year from 2009-2012. That seems to be the largest hang-up I have with producers and getting information to turn out correctly. RMA acre data often includes additional acres that were once pasture or CRP that are now in production but not accounted for in your base acres with FSA. So you have to use FSA production acres in this tool for the information to come out correctly for your farms. It also is a life-saver for farms that are joined together or split out….takes the headache out of figuring planted acres in those years! Note: The above eraser sheet is just an example so you know what one looks like. It is NOT used for inputting or double checking in the next several screen shots.

On the “edit” page when entering a farm unit, at the top of the page, you don’t need a description, but can add one if you wish. To simplify and save time on the bottom half of the page: ONLY entering CC yield and base acres for the specific crop saves a great deal of time. You don’t need basis, crop insurance, or insurance policy if you ARE NOT using this tool to make a crop insurance decision. You also only need “future acres” if you are interested in looking at crop insurance, or if you are interested in evaluating ARC-IC as an option. Inputting “0” for future acres just provides a summary of ARC-Co vs. PLC payment projections. Then press “save”.
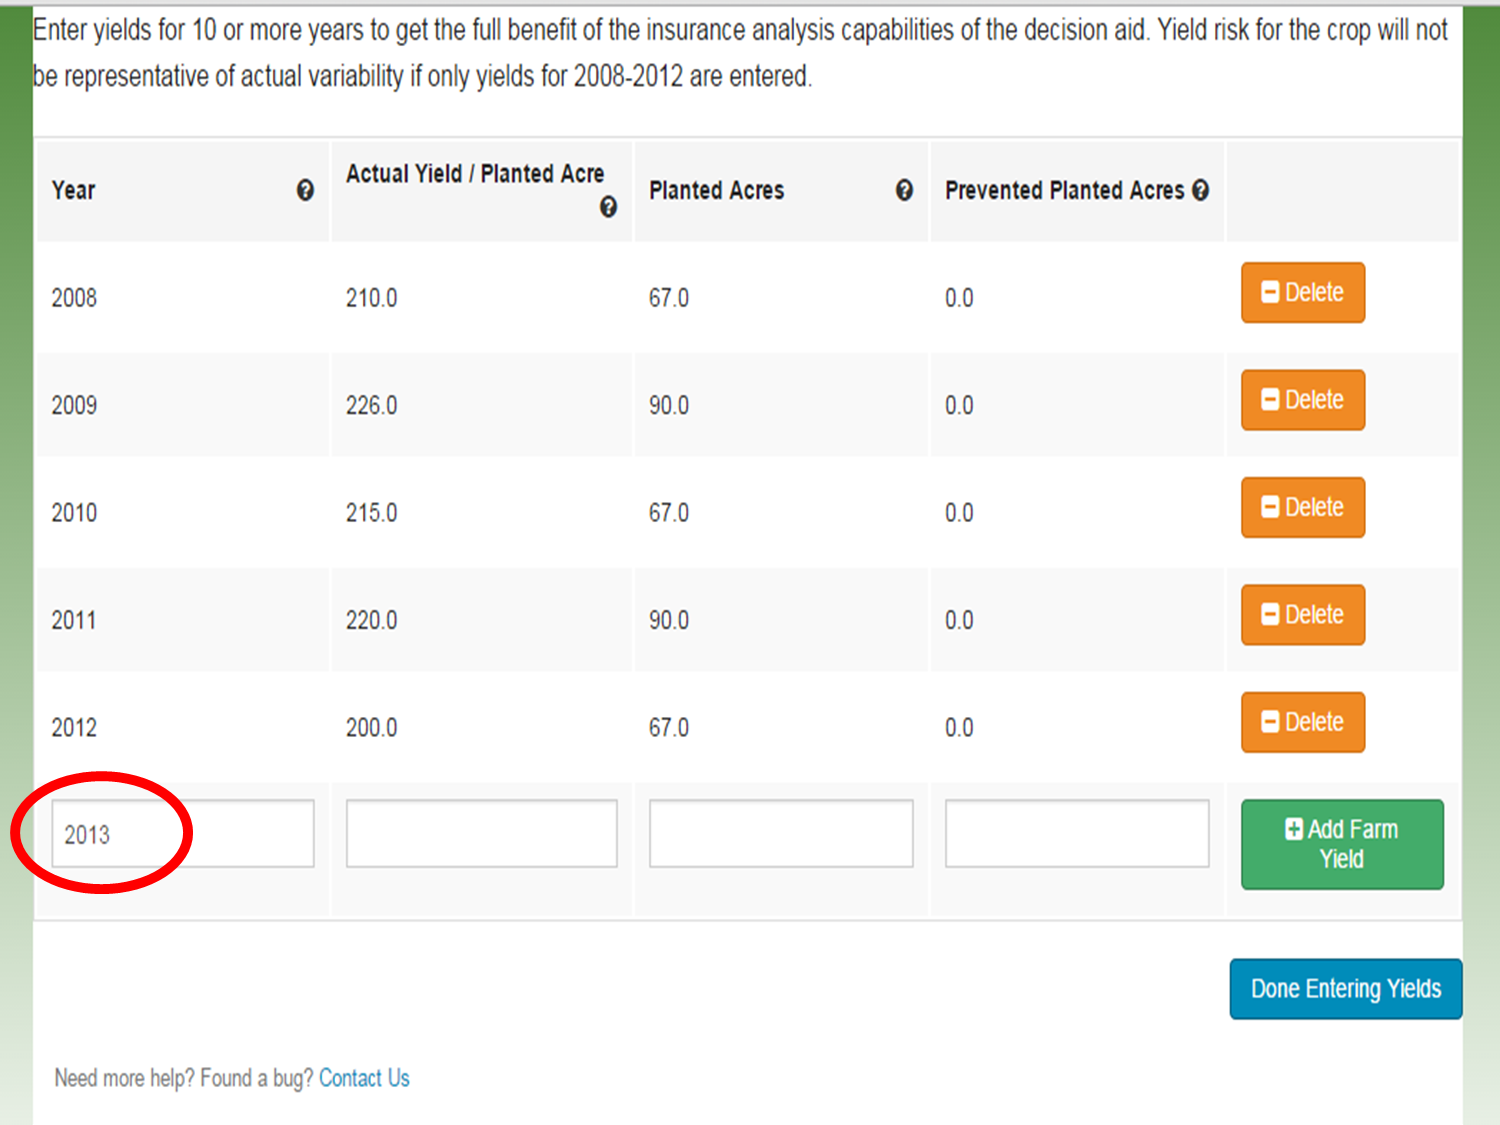
When entering yields, you need to enter one more date after all your yield data has been entered for the data to save properly. In this example, I have inputted yield data for 2008-2012. I then added “2013” and pressed “save yield data”. Not doing this step will delete your last row of yield information. On “planted acres” use production acres from FSA vs. RMA as this provides the correct acres for base reallocation decision and thus, correct potential payments based on those acres. 2008-2012 is necessary to determine updated yield. 2009-2012 acres are needed for determining base reallocation. The acres for 2008 will not influence or throw off the acres in this tool.

For crops in which you have old base acres but you have not produced since 2008, you can enter yields by adding a “0” in them as shown here. This does take time, so you can also skip this step as shown in the next screen shot without affecting your analysis.

UPDATE: If you wish to save additional time, you DON’T have to enter in “0” for yields for old base acre crops you didn’t plant from 2009-2012. Instead, on the home screen, simply hit “save” after entering in old base acres and CC yield for crops you no longer plant and skip entering yields for these crops. The output is the same (Thanks to Randy Pryor, Nebraska Educator in Saline County for this time-saving tip!)

Once all your crop information is entered for every one of your farms, you need to double check your data. First, Click on the “Yield Update” decision tool. The first screen shows what you entered and gives you a chance to check your information. Double check that your CC yields are entered correctly and that the yields look correct for what was entered. If the information is correct, then click on the “information is correct” button. If it is not, click on “home” and go back to the crop and farm where the information needs to be corrected. Note that if you had a crop that did not have CC yield on your FSA sheet because you also had no old base acres for that crop, on the “Home” screen enter “0” for CC yield and “0” for base acres. Then the County plug yield is inserted as the CC yield on this screen.

You will then see the yield updates for all your crops on all your farms that you inputted. You can print this screen for your information. A couple things to look for on this sheet. Whenever the 2013 CC Yield is higher than PLC Yield, it’s probably wise not to change that yield. Also a note for corn in particular, I like to go through all the farms and highlight the farm with the highest PLC corn yield. When having difficulty making a decision between ARC-Co vs. PLC, crops with highest PLC yields will offer the best PLC payments.

Next it’s time to look at the “base reallocation decision tool”. The first screen is a double check for you. It’s very important that the current base acres and reallocation acres match what was given you by the FSA office. Not inputting production acres based on FSA records (shown in top table) can throw off the potential base reallocation in the lower table. If the current base and potential reallocation base agrees with what was provided from FSA, simply push the “information is correct” button. If it doesn’t match, you will need to go back to the home screen and change the production acres so that the total production matches up to total base acres each year from 2009-2012 in order for the base reallocation to be correct. One more note: If you have split irrigated and non-irrigated acres, make sure to take a % of base acres assigned to the crop. (Ex. This farm has a total of 50 corn base acres. If 50% your acres are irrigated corn and you were in a county with split irrigated/non-irrigated opportunity, then assign 25 base acres to irrigated corn on the home screen and 25 base acres to non-irrigated corn). Inputting 50 corn base acres for both irrigated corn and non-irrigated corn would give you a total of 100 base acres which is 50 acres too many and will provide incorrect information.

Next you have an opportunity to select prices. I typically select USDA prices for all crops first. Then hit the “analyze” button. When the following screen appears, I click “download” then print the PDF that appears one-sided. This ensures that information for each farm number does not end up back to back with another farm number if you print two-sided. I then scroll to the bottom of this page, click “change prices” and click all the FAPRI prices, analyze, download, and print one-sided again. It does take some paper, but you’ll see why I recommend this shortly. It also allows you to keep farms separate if you’re showing results to landlords and/or tenants.
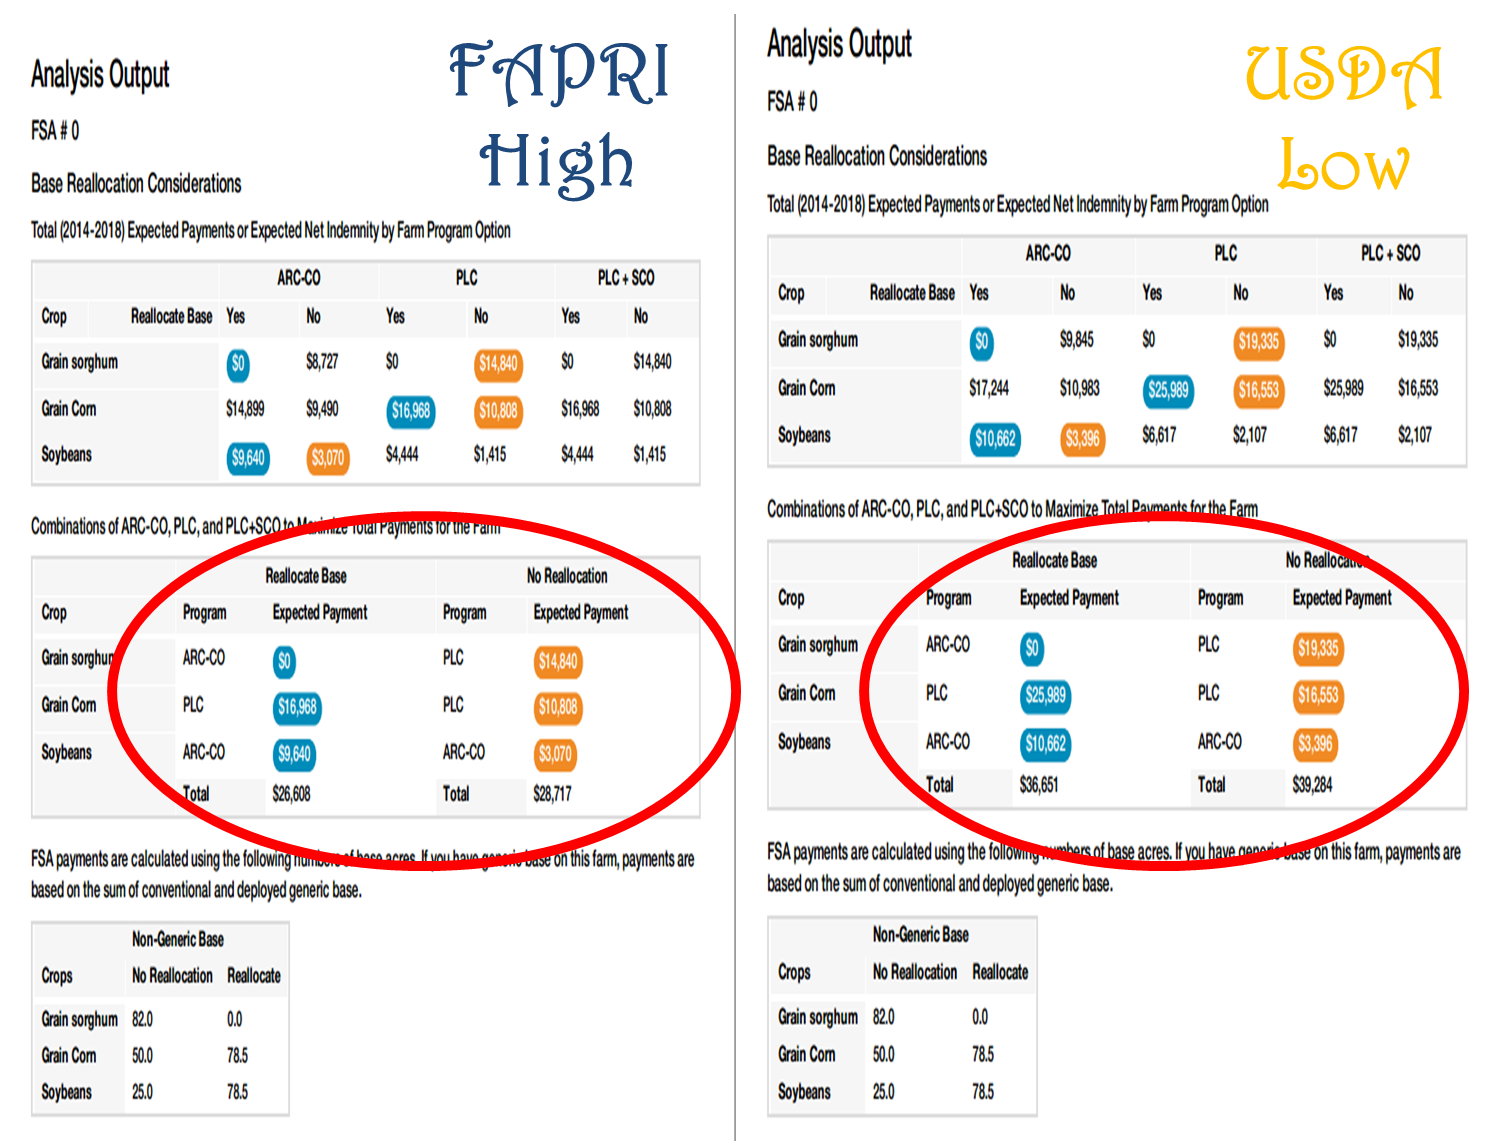
Once I print both sets of prices, the gals in my office and I staple together each farm number. We write “high” for FAPRI prices and “low” for USDA prices. I then place the High and Low together by farm number and farm by farm, go through the output with the farmers. Ultimately, I’m looking for trends when both the higher and lower prices agree. In this example, we are first looking at the base acre reallocation decision. Blue bubbles mean higher payments with reallocation; orange means higher payments without reallocation. Look at the bottom line for total payments. Notice in this example that for both low and higher prices, not reallocating the base is consistently higher. To help explain this, look at the base acre information below. What is occurring for this particular farm is a loss of grain base from 132 to 78.5 grain base acres. So essentially for this farm, the increase in corn base acres was not enough to off-set the milo payment from old base. The farmer then has to choose if he/she wants to reallocate base to what is currently planted, or retain base acres to protect grain base and obtain the milo payment. The other thing to notice is the decision of ARC-Co or PLC for each crop and how well they match between high and low prices. In this case, if the farmer chooses no reallocation, PLC is most consistent for milo and corn while ARC-Co is most consistent for soybeans. When both high and lower prices agree like this, it helps make decisions easier. You can always go back and play with the prices more, but you have to be careful with that. Remember, your decision ultimately is based on what you feel future prices will be for the next five years.
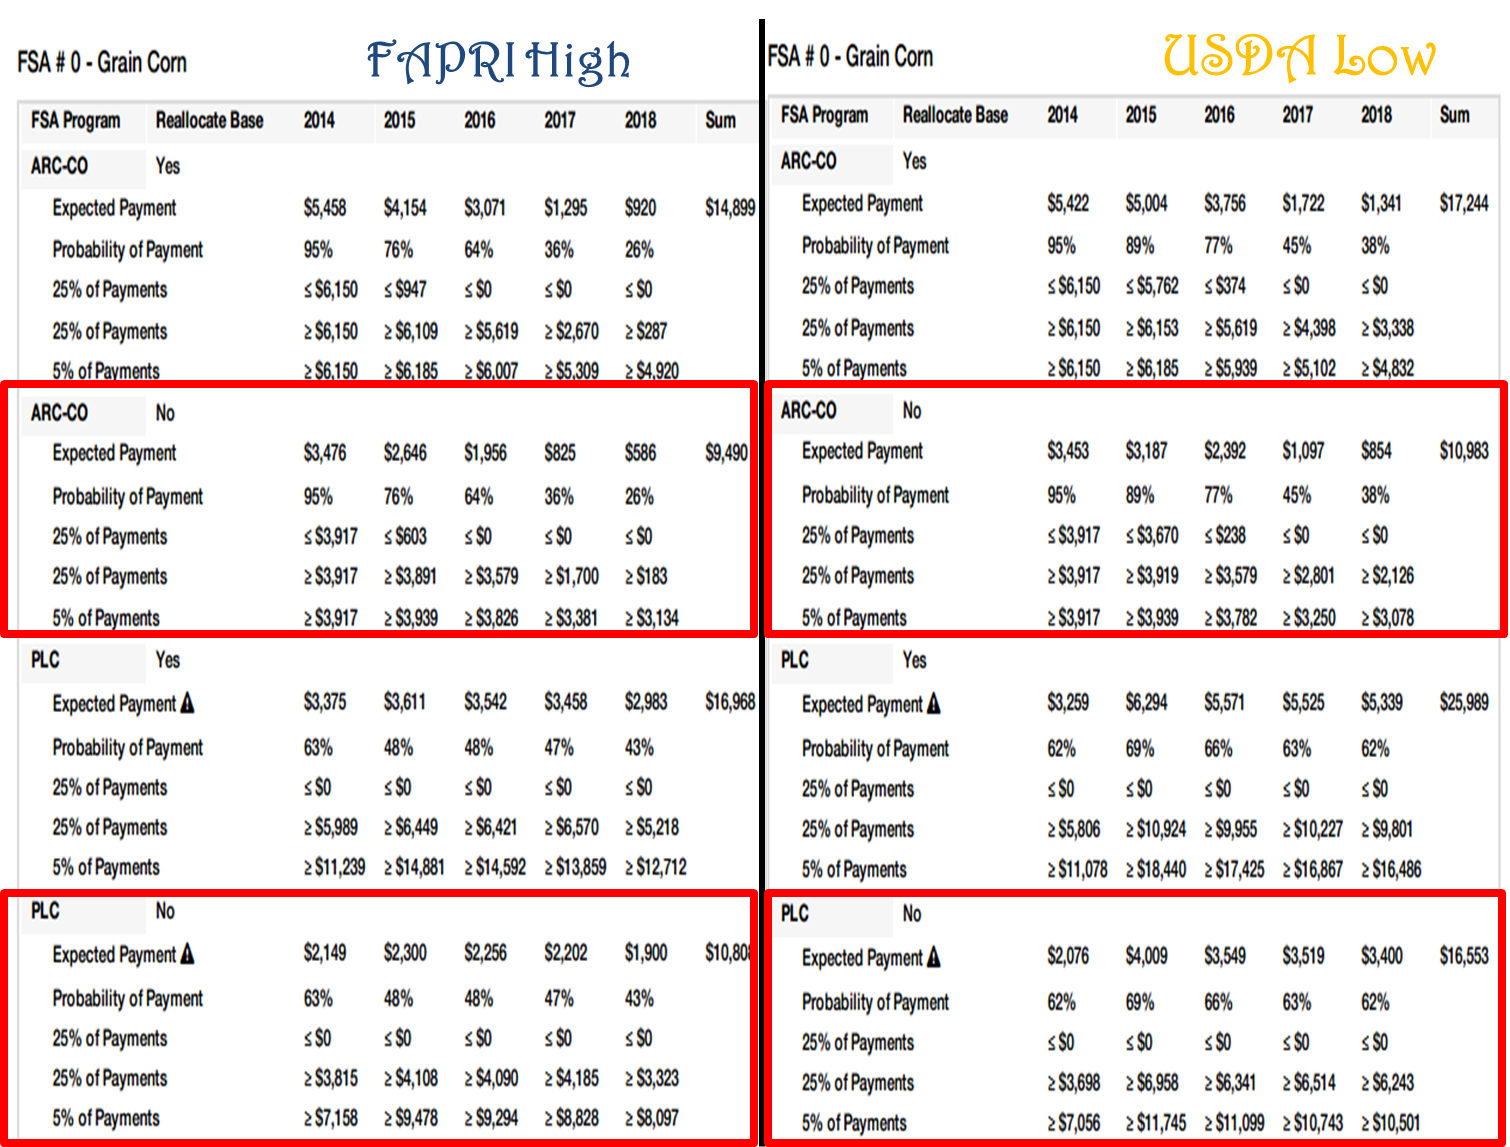
The final thing I like to do is analyze the output for higher and lower prices crop by crop, especially for farms where Corn switches decisions on the first page from ARC-Co with FAPRI prices to PLC with USDA prices. It comes down to what the producer feels prices will be the next 5 years. I compare the ARC-Co vs. PLC prices for whichever decision the farmer makes regarding base reallocation. In this example, let’s say the farmer decides to not reallocate his/her acres. We then compare ARC-Co vs. PLC for both FAPRI and USDA prices for each crop. Besides the total payment over the length of the farm bill based on these prices, I also like to compare payments year by year with both options and look at probabilities of those payments based on the projected FAPRI and USDA prices. In this situation, PLC provides higher payments in both higher and lower price situations over the life of the farm bill. ARC-Co provides slightly larger payments the first one or two years depending on price. One thing to keep in mind: If FAPRI prices are correct, then the PLC payments for years 2015-2018 go to $0 because FAPRI is estimating prices above the $3.70 trigger price for corn. So why does the tool show a PLC payment for FAPRI prices? It is taking into account 500 scenarios at one time that all have a chance of occurring in the future and the probability of payment if prices are at, above, or below the predicted FAPRI price for each year. Same for USDA prices. So it’s important to always keep this in mind when analyzing the results.
Hopefully this post was helpful to you in understanding how to simplify your input into this tool, to understand the importance of accuracy, and to understand one way of analyzing data from the Texas A&M Decision tool! You can view more information by checking out these YouTube videos.

