Blog Archives
Apps and Mobile Sites for Mobile Devices on the Farm
It didn’t take long for the phrase “there’s an app for that” to be seen and heard regularly in the phone and mobile device world. Today, there are many apps and mobile websites that can be fantastic tools for producers to use in decision-making. University of Nebraska Extension has developed several mobile apps to take a look at and be sure to visit our site often to learn of additional new apps.
In addition to our Extension Apps, Dennis Kahl, UNL Extension Educator, and I have also compiled a list of a few mobile apps that we think could be useful to farmers yet this year as they get closer to harvest, but also for next year to test out and see if they will indeed help them do work quicker and make decisions more accurately.
Today we are going to highlight a few mobile applications and mobile websites that producers may be using now as they make preparations for fall harvest.
- UNL CropWater – provides an easy way to estimate soil water status based on Watermark sensors installed at depths of 1, 2, and 3 feet. With these sensor readings, the Crop Water app will estimate the water used as well as what is still available for Nebraska soils.
- Market Journal – Television for Ag Business Decisions. Weekly crop reports, markets, weather and current insect,
 disease and harvest issues. It was also listed at Agriculture.com’s #1 ag app for 2013.
 - RealAgriculture – focuses on the issues that are impacting agriculture. The site is focused on getting farmers the opinions on issues so that you not only get the news but the insight into what the news means in the production business.
- DTN/PF – The Progressive Farmer – provides market data, link charts to market data for single, seamless view of how the latest prices correlate with current market trends.
- Farm Progress – Keep up on local ag news, grain and livestock markets, enhanced weather and blogs as well as Nebraska Farmer magazine.
- Husker Harvest Days Show – Maximize your time at Husker Harvest Days with this application that includes exhibitor and category lists, show maps and other tools to help you maximize your time at the show.
- Ag PhD Harvest Loss Calculator – Allows farmers to estimate yield loss before and during harvest by recording the number of individual corn, soybean, wheat, sorghum, barley or oat seeds found on the ground in a square foot.
- Combine Performance Optimizer by John Deere – Help operators adjust and set the critical settings for next year’s harvest of small and large grain crops to improve machine performance.
- Calibrate My Sprayer – Aid in the proper calibration of spraying equipment.
- In addition to the apps listed above, Crop Life featured a story of the Top 13 Mobile Ag Apps for 2013 and Agriculture.com has a list of mobile apps. Take a look at these as well.

With wireless technology available in most areas of the state, we utilize Verizon Wireless with our mobile devices in the field and in our communities to update various social media outlets such as Twitter, Facebook and blogs. Mobile access has allowed University of Nebraska Lincoln Extension to provide current information and situations in the field at all times. We encourage producers to subscribe to various resources including:
- Twitter
- @UNL_Cropwatch
- @UNLBeef
- @MarketJournal
- @IANRNewsService
- @UNLExtension
- For information on some of the newest technology, visit Innovative Tips for Rural Communities blog.
- If you are interested in staying up-to-date with crop information be sure to subscribe to and bookmark cropwatch.unl.edu and subscribe to Jenreesources Extension Blog.
Special thanks to Dennis Kahl as a Guest blog contributor to this post!
Goss’ Wilt in Corn
Goss’ wilt was found this week in corn damaged from Memorial Day storms in Clay County. I’ve also received pictures that appeared to be Goss’ from crop consultants in other areas of the State. Goss’ wilt lesions have a wavy edge, have a varnished look to them when wet, and have characteristic black “freckles” within and particularly along the lesion edges. We are seeing some plant death due to the systemic version of Goss’ wilt. This can be seen by taking a cross-section of the stem and looking for orange discoloration in the vascular bundles. Because this is a bacterial disease, fungicides are not effective in controlling Goss’ wilt. If you are interested in trying a product that is labeled for treating bacterial diseases in corn, we would recommend you test its effectiveness via on-farm research. Spraying in a paired comparison treatment design will give you a true answer if the product made a difference for you or not.
To do this simply: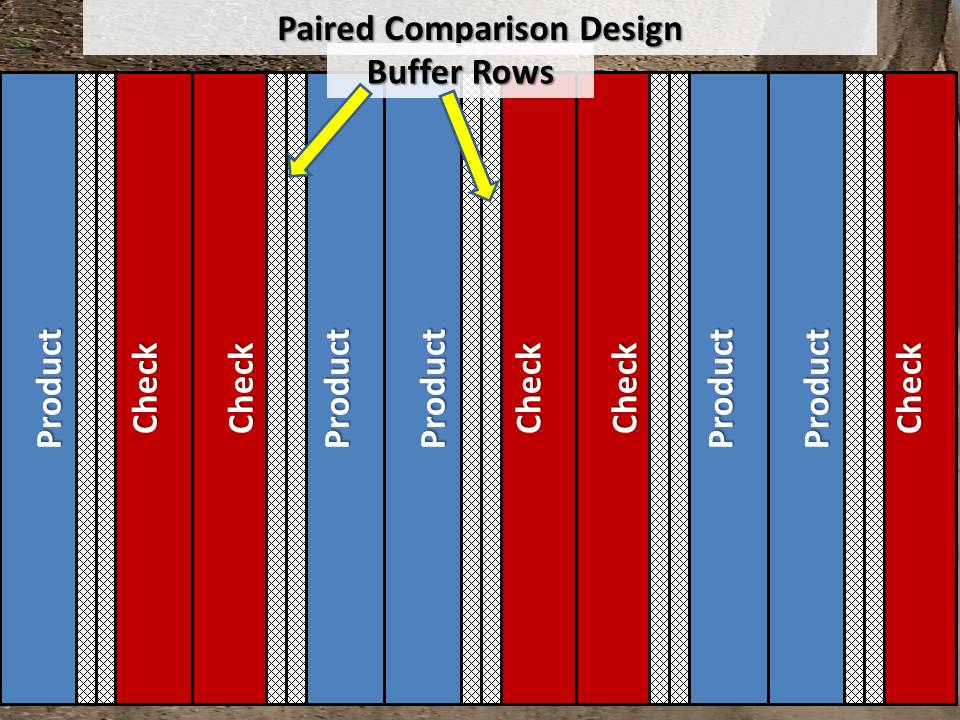
1-Spray a pass or round with the product (depending on sprayer size) to ensure you can harvest two passes from the center of the treated area.
2-Skip the same amount of distance as you previously sprayed.
Repeat steps 1-2 at least three more times
Mark a few plants in each plot and take photos throughout the growing season to determine if disease progresses or not. You may also wish to keep track of percent of plants affected in each untreated and treated area throughout the season, and check for percent stalk rot and harvest population in each area before harvest as well.
Make sure to harvest two passes from the center of each treated and untreated  area. Then compare the weights as shown in the harvest figure. Please let Jenny Rees jrees2@unl.edu (402) 762-3644 know if you decide to conduct this study and if you have any questions!
More information:
Goss’s Wilt from UNL
Sample Submission to UNL Plant and Pest Diagnostic Clinic
Nebraska On-Farm Research Network
Crop Update 6-20-13
The sun has been welcomed and crops are rapidly growing in South Central Nebraska! Corn right now is between V6-V8 (6-8 leaf) for the most part. Quite a few farmers were side-dressing and  hilling corn the past two weeks. It never fails that corn looks a little stressed after this as moisture is released from the soil and roots aren’t quite down to deeper moisture.
Installing watermark sensors for irrigation scheduling, we’re finding good moisture to 3 feet in all fields in the area. The driest fields are those which were converted from pasture last year and we want to be watching the third foot especially in those fields. Pivots are running in some fields because corn looks stressed, but there’s plenty of moisture in the soil based on the watermark sensor readings I’m receiving for the entire area. So we would recommend to allow your crops to continue to root down to uptake deeper moisture and nitrogen.
The last few weeks we observed many patterns from fertilizer applications in fields but as corn and root systems are developing, they are growing out of it. We’ve also observed some rapid growth syndrome in plants. This can result from the quick transition we had from cooler temperatures to warmer temperatures, which leads to rapid leaf growth faster than they can emerge from the whorl. Plants may have some twisted whorls and/or lighter discoloration of these leaves, but they will green up upon unfurling and receiving sunlight. This shouldn’t affect yield.
Damping off has been a problem in areas where we had water ponded or saturated conditions for periods of time. We’ve also observed some uneven emergence in various fields from potentially a combination of factors including some cold shock to germinating seedlings.
We began applying sugar to our on-farm research sugar vs. check studies in corn. We will continue to monitor disease and insect pressure in these plots and determine percent stalk rot and yield at the end of the season.
Leaf and stripe rust can be observed in wheat fields in the area and wheat is beginning to turn. We had some problems with wheat streak mosaic virus in the area again affecting producers’ neighboring fields when volunteer wheat wasn’t killed last fall. Alfalfa is beginning to regrow after first cutting and we’re encouraging producers to look for alfalfa weevils. All our crops could really use a nice slow rain right now!
Weed Science Field Day
Hope to see you at this weed science field day at UNL’s South Central Ag Lab near Clay Center on July 2nd! No charge. Please RSVP to (402) 762-4403. More information at: http://scal.unl.edu.

Understanding Research Statistics
Dr. Charlie Wortmann, UNL Extension Soil Fertility Specialist, explains the power of statistics for understanding yield and other differences and non-differences for on-farm research.
Sugar Applications to Crops
For the past ten years I’ve come across farmers who really believed in applications of sugar to reduce their pest populations. Being no research to my knowledge to prove it, I tucked the observation in the back of my head for future reference. With farmers looking to increase yields and looking to other farmers such as Kip Cullers for information, some of our on-farm research producers were curious about sugar applications in their operations with the hopes of increasing yield.
Nebraska On-Farm Research Corn Results
Using the application rates that Kip Cullers uses, one Clay County producer applied 3 lbs of sugar (purchased pallet of cane or beet sugar from the local grocery store) per 10 gallons of water at V7-V8 on corn in 2010-2011. Cullers also tanked mixed the sugar solution with a post-herbicide application like glyphosate but this producer didn’t do that. To simulate any affect of the water or driving through the field, he also drove through the untreated check spraying water only. Two years of research results showed no significant increase in yield. However, there was a noticeable difference in standability at harvest. This producer did not apply a foliar fungicide either year. When it came to harvest, this producer needed the reel in 2010 for the untreated check. Stalk rot ratings were taken using the pinch test two weeks prior to harvest. To him, the $1.25/acre of sugar was worth it to improve standability even if yield was not significantly improved. You can view the full research report here.

Several York County producers have also tried this with one producer finding a non-statistical 2 bu/ac yield difference with the check yielding better while the other producers found a statisically significant 2 bu/ac increase to the sugar treatment. Another producer in Hamilton County is testing this using the corn product he grows-using 1 qt of corn sugar (high fructose corn syrup) per 10 gal of water applied still at V7-v8.
In 2012, a small plot study was conducted at UNL’s South Central Ag Lab near Clay Center to determine any differences between sugar application, fungicide application, and untreated check in corn. All treatments were applied at R2. Because of the drought in 2012, there was minimal disease pressure, thus there were no significant differences between the three treatments regarding area under the disease progress curve. The untreated check did show the most stalk rot (via the push lodging test). The sugar application reduced the lodging rating by half and the fungicide application showed the lowest lodging rating. For yield, there were no significant yield differences with the untreated check yielding the highest followed by the fungicide and sugar applications. The entire study report can be found here.
In Soybeans we have had producers apply 3 lbs sugar in 10 gallons of water at R3 (beginning pod). In all years, there have been no significant differences in yield. Lodging ratings were not taken as that is more variety and water dependent.
Additional research…
has shown that application of sugar to crops increases the numbers of beneficial insects in those fields. South Dakota research entomologists showed that lady beetles benefited from a combination of prey and non-prey foods. In a follow-up study, these entomologists applied sugar sprays to soybeans and quantified the frequency of sugar feeding by analyzing the gut contents of common lady beetles in three states. They found all the tested lady beetles regularly consumed sugar-like nectar in soybean fields, even when it wasn’t applied as a supplement. They also found more lady beetles in the sugar treated plots compared to the untreated plots.
At this time we can’t explain the standability effect we’re seeing from our sugar applications to corn. Our hypothesis is that early application of sugar to corn is increasing beneficial microbes that may be keeping the exposed brace roots and stalks healthier. We hope to conduct more research in the future to answer this question.
In conclusion,
the application of sugar to corn and soybeans has not always shown increased yield. However, in nearly all of the corn studies, sugar treated plots have shown increased stalk strength at harvest. Research has also shown an increase in the number of beneficial insects in fields where sugar was applied. Further research is needed to understand the interactions aiding stalk strength in corn.
If you are interested in conducting on-farm research studies in your field, please contact any of our UNL Extension Educators or Specialists! You can also follow the conversations this year via our Facebook page and Twitter feed!
What do you think of sugar applications to crops? Have you tried this in the past and if so, what were your results?
On-farm Research
Wow, I’m sorry I haven’t published much the past two months! Much has happened though as we’re in the middle of winter Extension ag programming season! I love this time of year seeing farmers and ag industry reps-and just chatting about what happened last year and speculating about the upcoming season.
Many of you are also attending numerous meetings. You’re gathering information regarding products and production practices. You may be wondering “Will this work on my farm?” Why not go a step further and see for yourself? On-farm research is a great way to test these questions for yourself using your own equipment in your own fields!
UNL Extension has partnered with the Nebraska Corn Board and Nebraska Corn Growers to form the Nebraska On-farm Research Network. There are three main studies we are conducting state-wide: corn population, corn nutrient, and corn irrigation studies…but we are open to helping you design a valid research experiment for your field to test what you would like-and it can be for a crop other than corn.
We have some upcoming opportunities for you to learn more. On February 11 and February 12 from 9:00 a.m.-3:00 p.m. at UNL’s Ag Research and Development Center near Mead and the York Co. Fairgrounds in York respectively, growers who conducted on-farm research in 2012 will be sharing their results; you can also learn more about conducting on-farm research in your own field. There is no charge for the meetings courtesy of the Farm Credit Services of America but we do need an RSVP for meal count and handouts. Please RSVP by calling (402)624-8030 for ARDC or (402)362-5508 for the program in York. I hope to see you at these meetings as well!

Harvest #Soybeans at 13%
In spite of green stems and even leaves on some plants, soybeans are surprisingly drier than what you may think. I’ve been hearing reports of  soybeans in the 7-10% moisture range already in spite of there also being some “lima beans” along with the low moisture beans at harvest.
Harvesting soybeans at 13% moisture is a combination of skill and maybe some luck. Why is 13% so critical? A standard bushel of soybeans weighs 60 lbs. and is 13% moisture. Often beans are delivered to the buyer at lower moisture than 13%. The difference between actual and desired moisture content will result in lost revenue to the grain producer. Here’s how the loss works based on UNL Extension’s “10 Easy Ways to boost profits up to $20/acre”:
- Since 13 percent of the weight is water, only 87 percent is dry matter. The dry matter in a standard bushel is 52.2 pounds and the remaining 7.8 pounds is water.
- If this bushel of soybeans is kept in an open basket and some moisture is allowed to evaporate, the net weight of beans would decrease. If the dry matter weight remains unchanged at the standard 52.2 pounds, the wet basis weight for any moisture content can be calculated.
- For example, a standard bushel at 13 percent moisture weighs 60 pounds. If the moisture content were reduced to 11 percent (89 percent dry matter), the wet basis weight per bushel of the soybeans would be 52.2 pounds of dry matter divided by .89=58.65 pounds. (1.35 pounds less than the standard 60 lb. weight of beans initially placed in the basket). For each 52.2 pounds of dry matter delivered at 11 percent moisture, you miss an opportunity to sell 1.35 pounds of water.
- It is standard practice for buyers to assume 60 pounds of soybeans constitutes a bushel when soybeans are at or below 13 percent moisture. When the beans are below 13 percent, the difference in water content is made up for by an equal number of pounds (wet basis) of soybeans.
- Assuming a 60 bushel per acre yield and selling price of $8.50 per bushel, the potential extra profit the producer could realize if the beans are harvested at 13 percent moisture instead of 11 percent is $11.48 per acre.
Rapid dry-down and difficulty harvesting green stems and pods are the most common reasons for harvesting at lower than standard moisture. The following practices can help producers maintain quality and expected moisture content.
- Adjust harvest practices. When harvesting tough or green stems, make combine adjustments and operate at slower speeds.
- Begin harvesting at 14 percent moisture. Try harvesting when some of the leaves are still dry on the plant; the beans may be drier than you think. Soybeans are fully mature and have stopped accumulating dry matter when 95 percent of the pods are at their mature tan color.
- Plan planting dates and variety selection to spread out plant maturity and harvest.
- Avoid harvest losses from shattering. Four to five beans on the ground per square foot can add up to one bushel per acre loss. Harvest at a slow pace and make adjustments to the combine to match conditions several times a day as conditions change.
Latest 2012 #Corn Yield Predictions
The 2012 corn growing season has been unusually hot and dry. To evaluate the impact on potential production at 12 sites across the Corn Belt, we used the Hybrid-Maize model to estimate end-of-season yield potential based on actual weather up to August 13 and historical long-term weather data thereafter. (Data from each of the past 30 years was used.) This approach gives a “real-time,” in-season estimate of expected yield potential (the median value shown inTable 1), and the most probable range (25th to 75th percentiles) depending on weather conditions from August 13 until the corn crop reaches maturity.
By comparing this range of possible simulated end-of-season yield potential against the long-term average (long-term Yp, fourth column from right in Table 1), it is possible to estimate the likelihood for below-average (25th percentile), average (median), or above-average (75th percentile) yields. Comparing estimated 2012 yield potential versus the long-term average gives the size of the expected yield difference. While the 25th percentile projection is most likely if weather conditions are harsher than normal from August 13 until crop maturity, the 75th percentile scenario is more likely if weather is more favorable than is typical at a given site. There is roughly a 50% probability that final yield potential will fall between the 25th and 75th percentile levels, a 75% chance that yield will be at or below the 75th percentile, and a 25% probability that it will be at or below the 25th percentile value.
Simulations were run for dryland corn in Iowa, Illinois, and South Dakota, and for both irrigated and dryland corn in Nebraska. Simulations were based on the typical planting date, hybrid relative maturity, plant population, and soil properties at each location. Underpinning data used in these simulations are provided in Table 1. Details about the Hybrid-Maize model and our simulation forecast methods can be found in a previous CropWatch article.
As the season progresses, the range of yield outcomes shrinks and the 25th and 75th percentile values converge toward the median value. Indeed, August 13 projections give a much narrower range than our projections two weeks earlier based on July 30 simulations. The good news is that projected yield potential since July 30 has stabilized or even increased slightly at 7 of 12 sites as weather has improved, especially during the most recent week. The bad news is that projections of final yield potential are below the long-term average at all but two sites.
Dryland Corn
Even in hot, dry years like 2012, parts of the Corn Belt escape untouched and catch adequate rainfall. This appears to be the case in the northern tier of the Corn Belt (e.g. Brookings, South Dakota) and near the Great Lakes (e.g. Dekalb, Illinois) where projected dryland yield potential is within 2% of the long-term average. In contrast, there is moderate yield loss of 26-33% for dryland corn in south central Nebraska (Clay Center), central and northeast Iowa (Gilbert and Nashua), and west central Illinois (Monmouth). Severe yield loss of 40-65% is projected for dryland corn in eastern and northeastern Nebraska (Mead, Concord), northwest Iowa (Sutherland), and south central Illinois (Bondville).
Irrigated Corn
In contrast to large loss of yield potential in these dryland systems, drought years like 2012 highlight the value of irrigated agriculture and the stability it provides to our food system. Although hotter than average temperatures have shortened the grain filling period at all irrigated sites, which reduces yield potential somewhat, projected decreases are modest at about 5% in south central Nebraska (Clay Center, Holdrege), and 10% in east and northeast Nebraska (O’Neill, Concord, Mead). High grain prices are likely to offset the impact such losses will have on profits from irrigated corn.
Model Reliability
Given the severity of reductions in yield potential at some locations, and the apparent lack of negative impact at others, the question arises as to how reliable these projections are? In areas with relatively little heat or water stress, past experience indicates that predictions of yield potential using Hybrid-Maize are robust. In contrast, we would expect predictions of yield loss to be underestimated by Hybrid-Maize in areas where there was high temperature stress during the critical two to three day period of pollination, or where there were large water deficits that severely reduced development of the leaf canopy before tasseling. Both phenomena are not well accounted for in the current version of the model although we plan to release an improved version of Hybrid-Maize later this year that addresses these deficiencies.
Summary
The bottom line is that 2012 will be a difficult year in terms of U.S. corn production. Although irrigated yields will be somewhat lower than long-term averages, dryland corn yield potential in much of the Corn Belt will be moderately (25-33% below normal) to severely reduced (40-65% below normal). Where both prolonged drought and high temperature stress at pollination occurred, yields could be reduced by 65% or more. The final outcome will be determined by weather conditions until maturity. Fortunately, predicted weather patterns indicate a trend toward more normal temperatures and rainfall in many places.
While 2012 will certainly be a significant drought year, episodic droughts of this magnitude have occurred at regular intervals in the U.S. Corn Belt over the past 100 years of recorded weather data. Nebraska is fortunate that about 70% of total corn production comes from irrigated systems, and that improved agronomic management practices such as conservation tillage and more stress-tolerant hybrids can significantly reduce dryland corn yield losses under moderate drought. But there is little that can be done to mitigate the impact of severe, prolonged drought especially when coupled with high temperature stress at critical growth periods.
Patricio Grassini, Research Associate Professor, Department of Agronomy and Horticulture
Jenny Rees, UNL Extension Educator
Haishun Yang, Associate Professor, Department of Agronomy and Horticulture
Kenneth G Cassman, Professor, Department of Agronomy and Horticulture
| Table 1. 2012 In-season yield potential forecasts as of August 13 using UNL Hybrid-Maize Model | ||||||||
|
|
||||||||
| Location, State |
Water Regime |
PP¶(ac-1) |
RM¶ (days) |
Planting Date¶ |
Long-term |
2012 Forecasted Yp (bu/ac) |
||
|
75th* |
Median |
|||||||
|
|
||||||||
| Holdrege, NE |
Irrigated |
32.4k |
113 |
April 27 |
248 |
239 |
232 |
|
| Clay Center, NE |
Irrigated |
32.4k |
113 |
April 23 |
250 |
241 |
237 |
|
| Mead, NE |
Irrigated |
32.4k |
113 |
April 30 |
240 |
221 |
216 |
|
| Concord, NE |
Irrigated |
32.4k |
104 |
May 3 |
235 |
210 |
208 |
|
| O’Neill, NE |
Irrigated |
32.4k |
106 |
May 3 |
225 |
212 |
203 |
|
|
|
||||||||
| Brookings, SD |
Rainfed |
30.0k |
98 |
May 4 |
120 |
127 |
118 |
|
|
|
||||||||
| Sutherland, IA |
Rainfed |
31.4k |
99 |
May 1 |
168 |
110 |
99 |
|
| Gilbert, IA |
Rainfed |
32.4k |
110 |
April 26 |
200 |
157 |
144 |
|
| Nashua, IA |
Rainfed |
32.4k |
99 |
May 1 |
198 |
152 |
147 |
|
|
|
||||||||
| Monmouth, IL |
Rainfed |
32.4k |
112 |
April 27 |
212 |
161 |
143 |
|
| DeKalb, IL |
Rainfed |
32.4k |
111 |
May 1 |
201 |
227 |
204 |
|
| Bondville, IL |
Rainfed |
32.4k |
114 |
April 20 |
197 |
110 |
105 |
|
|
|
||||||||
| ¶ Simulations based on dominant soil series, average planting date, and plant population (PP) and relative maturity (RM) of most widespread hybrid at each location (Grassini et al., 2009). ‡ Average (20+ years) simulated yield potential (Yp). * 75th percentile yields, which represent favorable and unfavorable weather scenarios for the rest of the season. |
||||||||

