Blog Archives
Drought and Nitrogen Use Efficiency
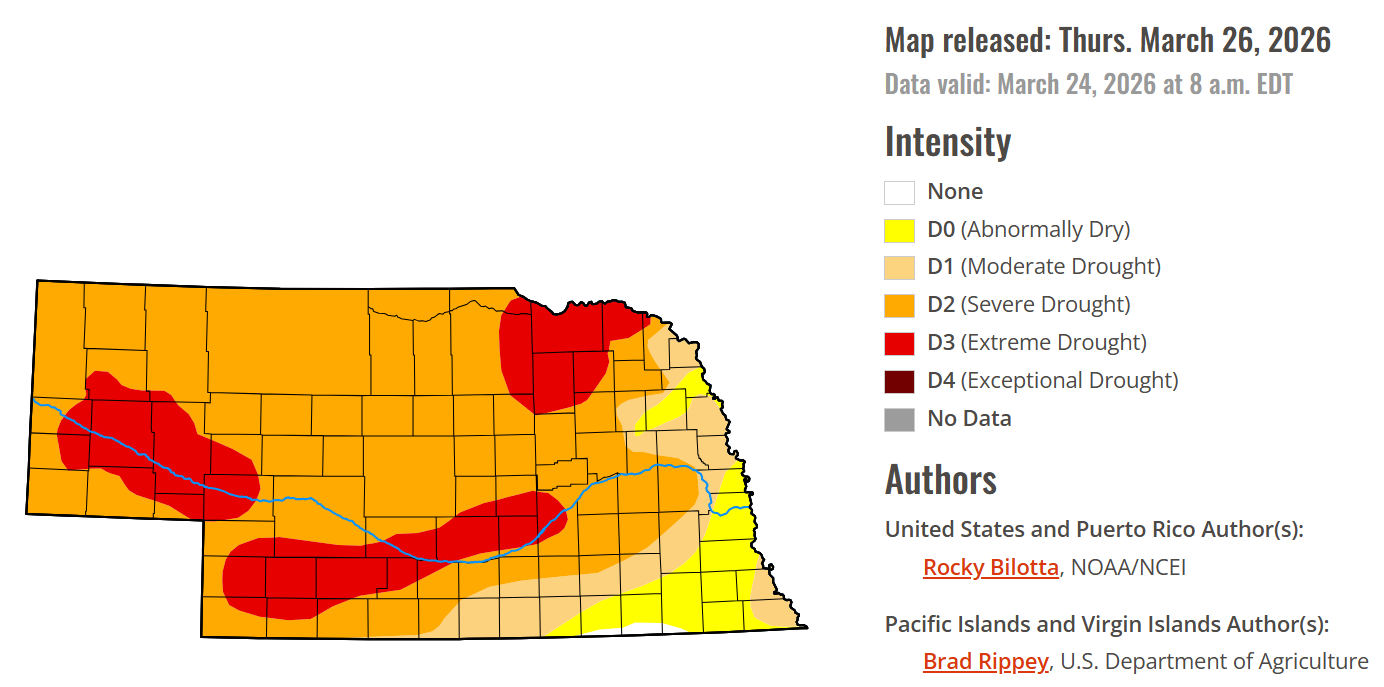
Drought: As of Thursday’s drought monitor release, 99.6% of Nebraska is abnormally dry/in drought. This same week in 2023 was also at 99.6% and similar to 2025 at 98.2%.
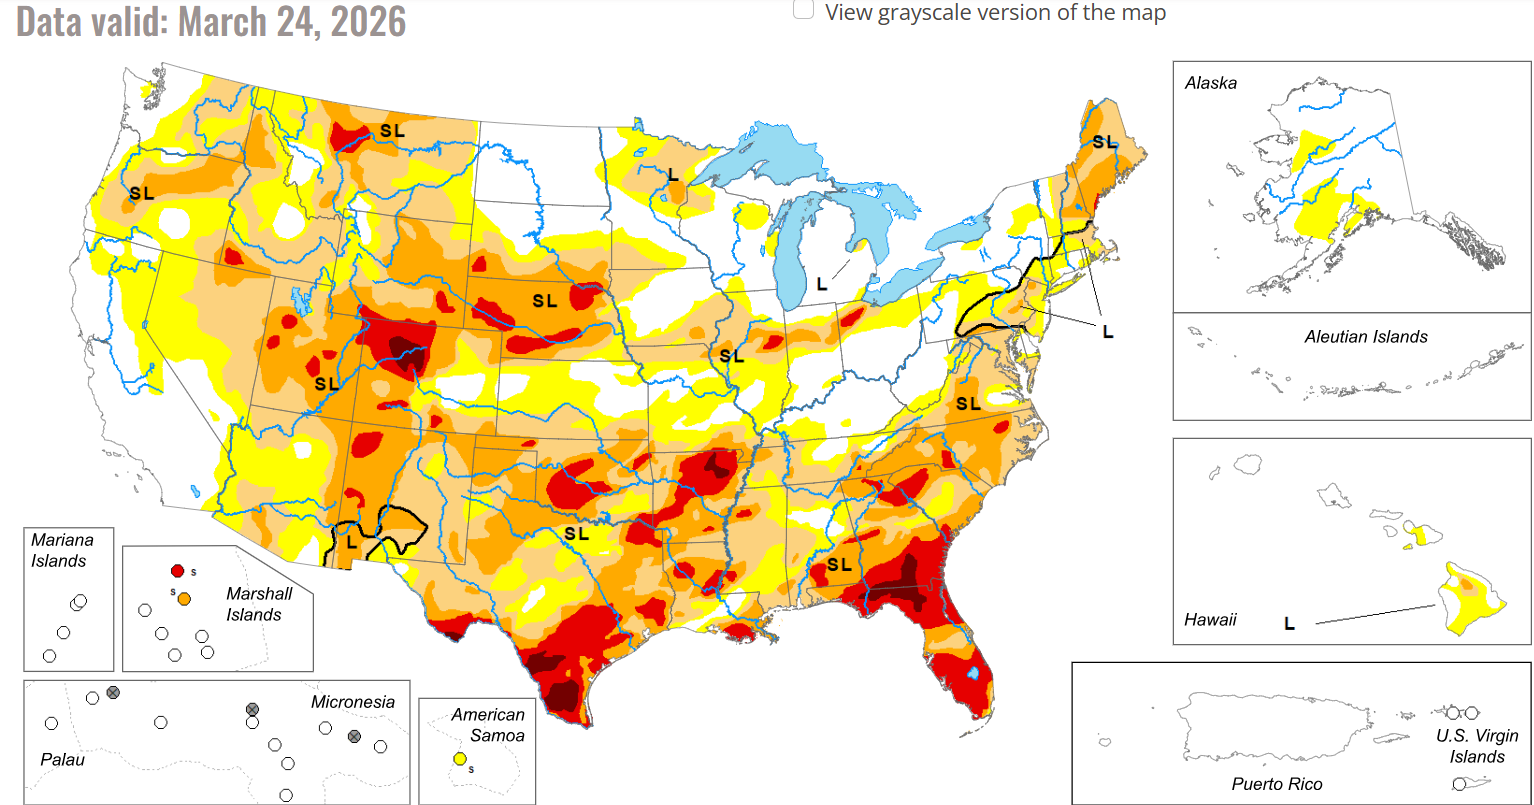
What’s also interesting is that currently 77.1% of the entire U.S. is abnormally dry/in drought. That’s actually the highest for last week on record for the U.S. I could find. The other closest years for entire U.S. drought were 72% in 2022; 67% in 2025; and 65% in 2002, 2013, and 2021. We all know it’s dry and we’ll keep praying for much-needed rain.
Cover Crop Termination Timing: I’ve received a number of questions about cover crop termination timing. Several have also contacted me asking about the potential of utilizing these covers for custom grazing cattle impacted by wildfire areas instead of terminating the covers. There’s a number of questions around this and ideas on how to compensate for the grazing/cattle care. To be clear, my goal in sharing this is to help with the questions I’m receiving and to help with a real situation Nebraskans are facing right now. I think the unknowns are how many producers are willing to offer this type of service and how many cattle impacted by wildfires need custom acres to graze. Because producers have asked me who to talk with to obtain answers, I’d suggest contacting the NDA director’s office and possibly commodity groups such as Nebraska Cattlemen’s or Nebraska Farm Bureau to share your thoughts and see if there’s possibility for a decision around this soon.
For farmers with non-irrigated ground, if you’re not planning on using the cover crops for forage, watch soil moisture for your specific fields. While I promote planting crops green into cover crops, the soil moisture situation is dire in the seed zone and terminating pre-plant may be the wisest option. For growers with irrigated ground, again, watch your soil moisture for your specific fields. If choosing to terminate pre-plant, one option is to use clethodim (follow label regarding the wait period of 7-10 days prior to planting corn). Clethodim provides a slower kill and doesn’t cause the covers to “melt down” as rapidly as roundup does. If you choose to plant green, have pivots ready to go in the event you need to provide water into the seed zone after planting into the growing cover.
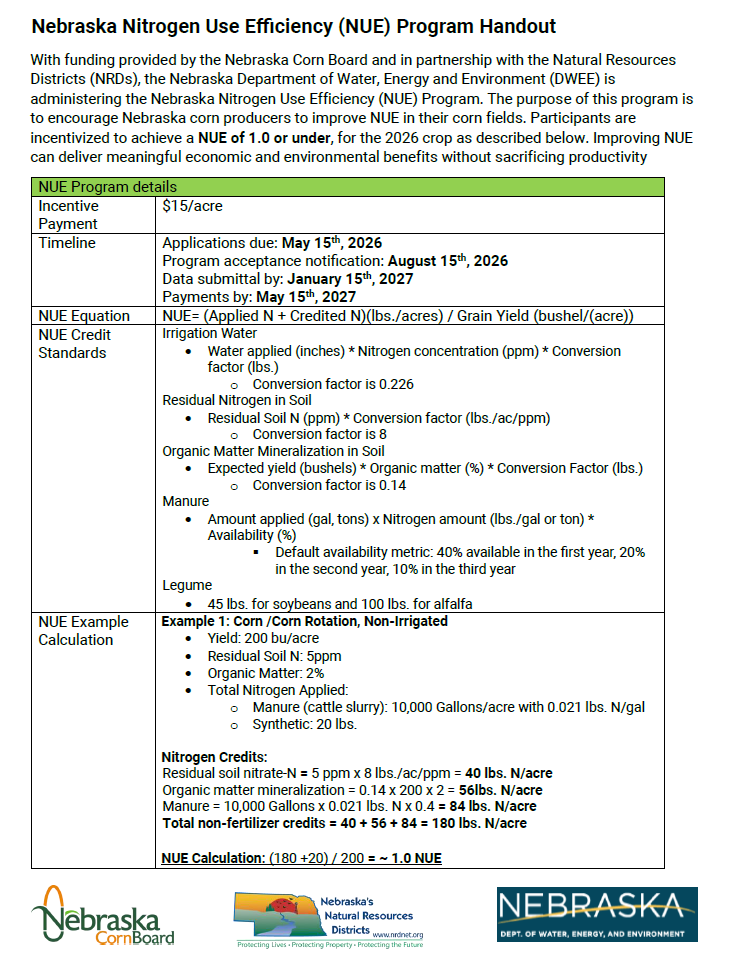
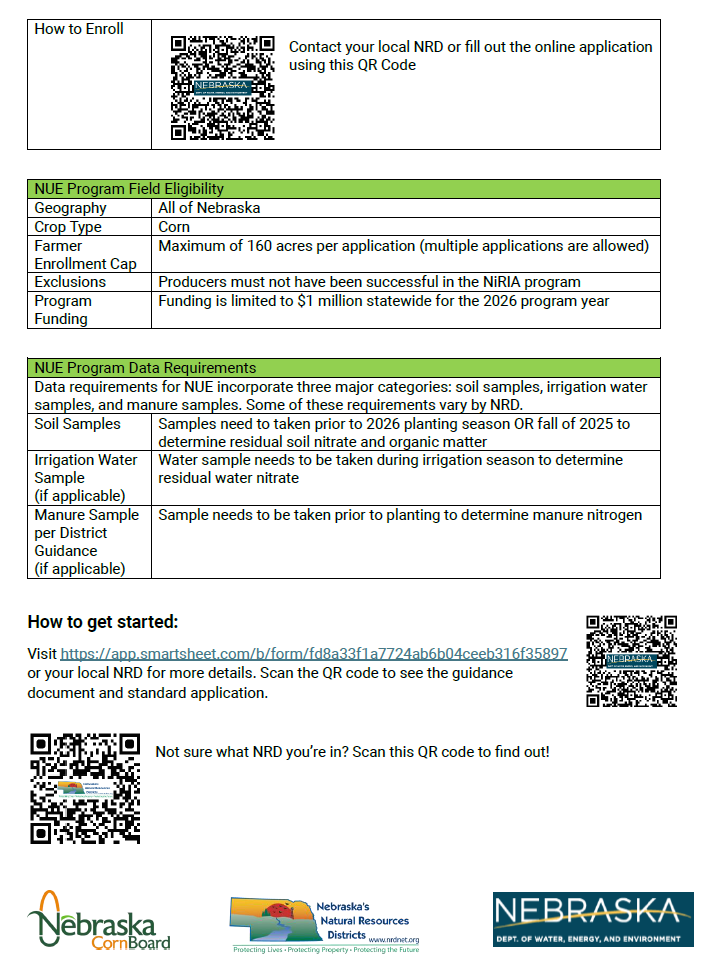
2026 Nebraska Nitrogen Use Efficiency (NUE) Program: With funding provided by the Nebraska Corn Board and in partnership with the Natural Resources Districts (NRDs), the Nebraska Department of Water, Energy and Environment (DWEE) is administering the Nebraska Nitrogen Use Efficiency (NUE) Program. The purpose of this program is to encourage Nebraska corn producers to improve NUE in their corn fields. Participants are incentivized to achieve a NUE of 1.0 or under, for the 2026 crop as described below. Improving NUE can deliver meaningful economic and environmental benefits without sacrificing productivity.
Nitrogen Use Efficiency (NUE) measures how effectively a crop converts available nitrogen (N) into harvested grain yield, quantifying the relationship between N inputs and crop output. NUE accounts for total available N by including credits such as soil, water, legumes, and manure (lbs./acre) divided by grain yield (bu/acre).
For the 2026 cropping season, applications are due May 15th, 2026, pending funding status, and will be subject to NRD approval. NRD will review and prioritize the applications based on available funding. Methods for application prioritization will be established by each NRD with applicants notified no later than August 15th, 2026, whether their application has been approved or denied. Full details at: https://dnr.nebraska.gov/nebraska-nitrogen-use-efficiency-nue-program.
JenResources 5/11/25
Drought: While it’s sometimes difficult to write a column each week, the record of information on my blog through the years has been of help to me. I was thinking about this spring…how the rye and pastures weren’t growing, and now how the rye and wheat went to head in non-irrigated ground weeks earlier than normal. Why are they heading so early this year? I think it’s because we’ve had such warm soil temperatures coupled with low surface and subsoil moisture in non-irrigated fields. I think the plants are stressed and went into reproductive mode.
I’m concerned that pastures will also be short and head out early too. It’s good to be prepared in the event that livestock producers need additional forage. In mid-April, a Drought Preparation Webinar was held and the recording can be found here: https://go.unl.edu/2025_drought_prep_webinar. There’s also a recent CropWatch article by Aaron Berger, Livestock Educator, sharing the economic tradeoffs of grazing wheat vs. taking it for grain for those with non-irrigated acres that are drought stressed or dealing with virus diseases. You can find the full article here: https://go.unl.edu/mrny.
I know irrigating crops like what is occurring is reminiscent of 2023 in watering crops up and activating herbicide. No one wants the irrigation season to start this early. For curiosity, I pulled the Drought Monitor maps from this week in 2023, 2024, and 2025. 2023 is the year I think of most closely to 2025 so far, even though the drought monitor map in 2023 was much more severe than what 2025 shows. For a planting season, 2025 reminds me more of 2012 with how early everything went into the ground with a warm growing season and no cold snaps. The drought monitor map for the area of the state I serve is similar to 2024, but we also know that mid- to late-May rains changed conditions from dry to too wet in areas north and east of here. Curious as to what year(s) any of you would compare this year to?
Ultimately, we’re not in control of the weather. For the livestock producers in particular, it may be wise to have a forage plan in place in the event that forage resources run short for your operation.
Seed Swap: On a lighter note, we have some interesting on-farm research projects this year! One we’re calling a Seed Swap. This will be my 10th year with the York Co. Corn Grower plot. Any extra seed that we vacuum out of planter boxes is mixed together and planted out. While it’s not a part of the official plot, that area has always beaten the highest yielding number in the plot by 5-10 bu/ac. And, it may not always work this way, but a handful of others also commented they’ve seen something similar. One farmer who had hosted the plot in the past had the idea of trying this via on-farm research. A group of farmers also liked the idea and they all decided on a “seed swap” where they each contributed a hybrid to be mixed together. The mix is compared to each farmer’s hybrid(s) of choice. So in 2025, we’ll have non-GMO and GMO seed swap studies. There’s also a grower who wanted to try this with soybeans, so he has a study combining different maturity groups.
A 2009 study in Ohio compared 5 hybrids vs. mixes of the hybrids. “No significant difference was seen when comparing the yield of a mixed hybrid stand to the average of the two hybrids that were used in the mixed planting. However, there was an observed tendency for the mixed hybrid treatments to out yield their single hybrid counterparts by an average of 4.2 bushel per acre.”
I realize the concept perhaps goes against what many are trying to do with increasing uniformity in fields. My hypothesis in what we’ve seen in the corn grower plot is that the range of maturities (110-120 days) allowed to catch any stragglers for pollination, there was increased diversity in disease/insect packages in combination with more defensive and racehorse hybrids. For those interested in soil health, I also think there’s something to diversity of root structures resulting in more sharing of nutrients and different microbial associations with roots. Those are just hypotheses and we’ll share what we see for results next winter!


Dry September 2024
Dry Conditions: With the dry conditions, harvest has been rapidly progressing. Two weeks ago, soybeans had green stems with seeds that were drier than people thought. Last week, many were harvesting soybeans in the 7-8% range. For corn I’ve been hearing a lot of 13-15% moisture and a couple reports down to 11%, but still with good kernel depth and quality. There’s unfortunately nothing we can do about this other than prioritize which fields to harvest. We’re in a race against time and the low moisture is due to weather conditions and hybrid specificity.
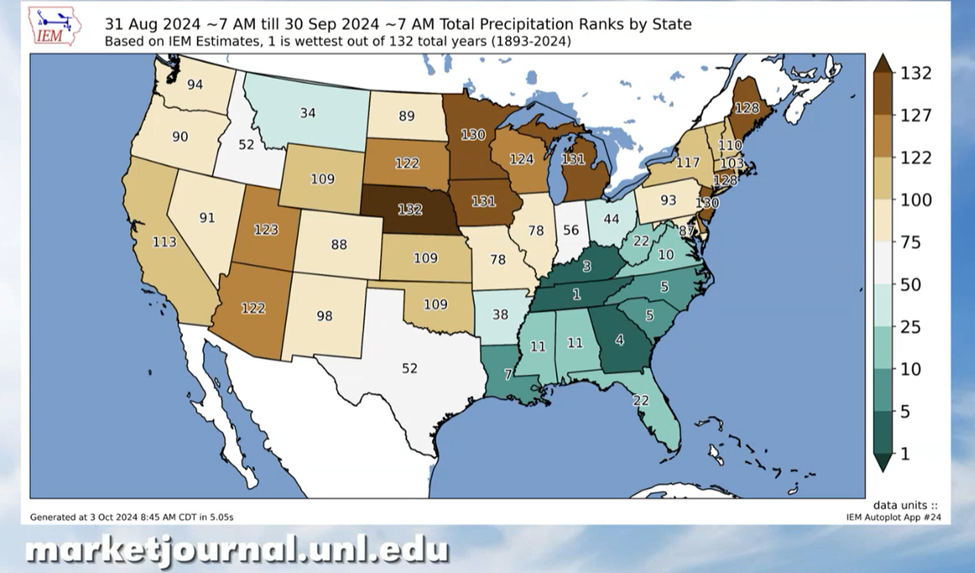
I’ve never seen it so dry in September. Eric Hunt, Extension Meteorologist, showed that September 2024 was the driest September in Nebraska on record (132 years). He also shared there’s no relief in site moisture-wise with above-average temps till at least the latter half of the month.
The lack of relative humidity and precipitation, intense sunshine, higher temperatures, and wind have all led to the grain moisture loss we’re seeing (which can be as much as 0.8-1.0 percentage points/day). Dr. Bob Nielsen, Extension Emeritus Corn Specialist from Perdue shared, “It is not uncommon for grain moisture to decline more than one percentage point per day over a period of days when conditions are warm, sunny, windy and dry.” Research that he and others conducted back in the 90’s showed that when corn matures also impacts drydown rate. Corn that matured in late August had a daily average drydown rate of 0.8 percentage points per day while corn that matured in late September averaged 0.4 percentage points per day. The corn borer pressure on non-gmo hybrids and late season disease pressure on all hybrids also led to plants dying/maturing early.
Corn hybrid characteristics can also impact kernel moisture. Hybrids that have thinner or permeable pericarp layers (outermost layer of the corn kernel), are more subject to moisture loss and faster drying rates in the field. I’m unsure how one knows this characteristic though.
You can look for these other characteristics resulting in quicker drydown: lower husk leaf number and thinner husk leaf, how soon the husk leaf tissue turns brown, how well the husk covers the ear (less coverage allows for faster drying), how tight the husk is (as looser husks will increase moisture loss), and how fast the ear turns down vs. remaining upright.

Fire Conditions: With the dry conditions and low humidity, we have a high risk of fire potential. I’m grateful to Nebraska DOT for posting the fire danger on signs throughout the state as a reminder to those traveling. Hopefully that will help reduce cigarette fires. Please keep thinking safety including fire safety with harvest. Days like Saturday are days to take a break from the field. Have fire extinguishers with you and charged, disks at fields, blow out combines regularly. Roads are so dangerous with the dust; turn lights on when traveling in the daylight. Please be safe! Safety resources: Educational Resources | College of Public Health | University of Nebraska Medical Center (unmc.edu)
Cover Crops and Small Grains: With the dry conditions, I’ve heard of several semi loads of wheat returned and not planted in the southern counties I serve. It’s hard to know what to do, but if a small grain is part of one’s rotation (which I feel there’s many benefits of), I’d recommend to stay the course with planting the current rotation and evaluate the situation next spring. It’s something to also discuss with crop insurance. Regarding irrigated ground, I have been recommending to put on 0.5”, potentially with two shots if needed, for cover crops. This may seem like a waste of water, so my explanation. The covers are an investment for soil erosion loss, uptaking excess nitrogen, aiding with weed control next year, and/or for grazing. With no soil moisture, the low amounts of irrigation are to get seeds growing or keep seedlings alive for the time being.
Trees and Lawns: We also need to be deeply watering trees in landscapes. Push a screwdriver in the ground to determine wetting depth. Kentucky bluegrass is shallower-rooted and doesn’t take heat as well as fescue. However, bluegrass will go dormant without dying, whereas fescue, even though it’s deeper rooted and more drought-tolerant, doesn’t go dormant from drought-stress, so it can die. After bluegrass has reached three weeks of dormancy and fescue has changed color, it’s recommended to water 0.5”/week to keep both grass species from dying.


JenREES 7/30/23
150th York County Fair: Hoping you can attend the 150th York County Fair this week! Full Schedule of

events at: http://www.yorkcountyfair.com. Raffle tickets are being sold for the York County Fair Foundation with proceeds used for projects at the fairgrounds. Only 400 tickets will be sold at $50.00 each. A total of 56 drawing winners will receive $150.00 each and the winning tickets get put back in the drawing for additional chances to win. Drawings will occur weekly from the first week of October 2023 through the last week of September 2024 (and daily winners during the 2024 York County Fair). Tickets can be purchased from Ag Society or Fair Foundation members, at a Fair booth in the Mercantile building during the County Fair, or at the York Co. Extension Office till Sept. 30 (or until all tickets are sold).
Weather Impacts: I keep saying we’re a long way from harvest and it seems like we continue to face difficulties. For me, it keeps reminding me that I’m not in control but I can look to and trust the One who is. Many worked so hard to keep livestock safe. Feel for those who unfortunately lost livestock to the heat and humidity. Farm Service Agency (FSA) asked that we remind producers of the Livestock Indemnity Program and to report livestock losses within 30 days of the losses occurring. Please call your local FSA office to provide an official notice of loss. The local office will share with you what is needed for appropriate documentation of losses.
It was a blessing to receive a widespread 2” of rain on Saturday morning! Also good to see something planted into some hail damaged fields. As storms continue to occur in different areas, what I’ve shared earlier in regards to forages still applies. Summer annuals can still be planted through Aug. 15 (unsure on haying depending on weather, but definitely can graze).
Flying/spreading oats, rye or other small grains with or without brassicas continues to be an option as well. Palmer is emerging. 2,4-D amine and 2,4-D ester are both labeled as “anytime” for applying before seeding any small grain. Read the specific label for any restrictions. Oats give the most fall forage. Earliest greenup in the spring is rye followed by wheat followed by triticale. Triticale will provide the most spring biomass but it comes on late (think June time-frame for haying).
Drought: By Friday afternoon, non-irrigated fields rapidly turned, were firing, and using fields for forage was the question, particularly from Nuckolls Co. I think most were just thinking ahead to having plans in place should they be needed. Reminder again, the field needs to be released by crop insurance. I called Dr. Mary Drewnoski to talk through grazing corn in brown silk to milk stages. We’re treating this as immature corn. So the considerations we gave before were the fact that nitrates would exist but that cattle would self-adapt as they graze the tops first. Any ears present will be mostly water. Mary’s main concern at this point was how much could be knocked down and under-utilized by allowing the full field vs. larger strip grazed areas. One can supplement with a few pounds of grain or with hay. She mentioned to not feed a non-protein nitrogen source (ex. lick tubs) when feeding high nitrate forages. Don’t turn out empty and allow access to plenty of fresh water. If plants end up completely brown before they’re released by crop insurance, it won’t change the nitrate concentration of those plants. Options at that point are still grazing or ensiling. For those who’ve shared they really want to hay the corn, know that your nitrate concentration will be highest with that option. Cut at least 8-12” above the ground. I would recommend sampling for nitrates after baling and also only consider this option if you have the ability to grind those bales and mix in a ration. Do NOT harvest or graze for at least three days following rain that “breaks” drought conditions. The rain causes an uptake of nitrogen from the soil, which is translocated into the plant. After three days, the nitrogen will have been converted to plant protein and is no longer in dangerous form.
Whether for drought or hail damage, for those trying silage, reposting Dr. Bruce Anderson’s silage info. “Fermentation usually (but not always) reduces nitrate levels and risk. Yield is about one ton per acre of silage for each harvested foot of earless corn plant (not counting the tassel). Feeding value is about 70% to 80% of well-eared corn silage. Corn with some grain (less than 50 bushels) tends to produce about one ton of silage for every five bushels of grain with a feed value about 80 to 90% of regular corn silage. Harvest timing is critical with silage to ensure the correct moisture for proper fermentation. Desired moisture level for silage is about 65%. Plants with any green leaves usually are too wet to chop for silage. For proper moisture, most leaves may need to be dead before chopping. The stalk and ear hold amazingly high water concentrations. For corn with no grain, even if all leaves are dead, the whole plant (and silage) moisture can be 70% if the stalk is still green and alive.
Once plants actually die they can rapidly dry down. There are several ways to reduce moisture content. If corn has pollinated, delay silage harvest until all chances of increased biomass tonnage have passed or plants naturally dry down to appropriate moisture levels. Corn can be windrowed and allowed to partially dry before chopping. Excessively wet material can be blended with drier feeds such as ground hay, cracked grain, or dried distillers grains. However, this can take a lot of material — about 500 lb of grain or hay to reduce each ton of chopped corn with 85% moisture down to 70% moisture. Silage inoculants may improve fermentation and preservation of drought-damaged silage.”


JenRees 6/18/23

Drought: Several have asked about the yield potential of non-irrigated pivot corners if they were irrigated at this point. I don’t know if anyone really knows. This column reaches such a wide area. There’s part of the area I serve that I don’t think there’s any yield potential. For other places, my guess is ears wouldn’t be more than 4-8 rows around. I asked a plant breeder for his perspective. He shared it could be possible for 100-120 bu/ac with rain, depending on how long it had been rolled, and for corn further along (late vegetative stages). I’m seeing non-irrigated corn in most area drought-stressed fields are 4-7 leaf vs. 8-12 leaf in the pivot irrigated portion. The research I found says, from Emergence to 12 leaf corn, an estimated 1-3% yield loss occurs for each day after 4 consecutive days of stress. Some corn in the area has been rolled for nearly 18 days. Here’s some math for consideration if it can help (I’m going to use 20 days of stress). Let’s say you typically receive 180 bu/ac non-irrigated yield. 1% yield loss/day for 20 days would result in a loss of 36 bu/ac. A 2% yield loss/day for 20 days would result in a loss of 72 bu/ac and a 3% yield loss/day for 20 days would result in a loss of 108 bu/ac.


I’m honestly surprised that the drought-stressed corn is still gray-blue/green in color overall with only a few scattered plants firing now. I know it’s hard to see the corn dying. Each situation varies regarding well capacity and if there’s other wells to water corners, how long the corn has been stressed, etc. Overall, my suggestion has been to not divert water from pivots to save corners. For beans, they’re putting energy into deeper roots with less above-ground growth. These small beans will most likely flower shortly and yield loss will be from aborted flowers, pods, or death of plants if we don’t get rain.
Several have also commented on weed control difficulties with drought-stressed weeds. There’s two well-written articles in this week’s CropWatch https://cropwatch.unl.edu about drought-stressed weeds.
ET/GDD info: The CropWatch ET (evapotranspiration) info. is now available at: https://cropwatch.unl.edu/gdd-etdata.
2nd Cutting Alfalfa: Non-irrigated alfalfa fields are short (6-12”) with some blooming. Received a question regarding to cut or not. Dr. Bruce Anderson had shared in previous years that one needs to obtain at least 0.5 ton/acre in order to pay for harvesting costs. With higher hay prices and short forage, you can determine what’s best for your situation. Alfalfa that goes dormant will regrow when rains occur. By leaving it alone, the alfalfa will go dormant and eventually lose the leaves from the stems. If you hay or shred it, it may try to regrow, but with no moisture, it will also go dormant. There’s also potential to damage crowns from driving on extremely stressed alfalfa. If you can fence it and have water access, grazing full-bloomed alfalfa is also an option and is low-risk for bloat at that stage.
Lawn Watering: Lawns are really showing drought stress. Kentucky bluegrass is shallower-rooted and doesn’t take heat as well as fescue. However, bluegrass will go dormant without dying, whereas fescue, even though it’s deeper rooted and more drought-tolerant, doesn’t go dormant from drought-stress, so it can die. After bluegrass has reached three weeks of dormancy and fescue has changed color, it’s recommended to water 0.5”/week to keep both grass species from dying.
Oak Leaf Tatters: Received calls in the Henderson/Bradshaw area about oak trees with leaves that looked like they’d been eaten; no insects were present. Several calls earlier in the year were regarding malformed oak leaves, primarily on young oak trees (1-5 years old). Oak leaf tatters is a condition characterized by Iowa State, where cold stress when tree leaves are emerging coupled with herbicide injury causes oak leaves to look deformed, tattered, or look like they’ve been eaten. I see problems every year with oak trees, primarily in lawns when ‘weed and feed’ products are applied when oak tree leaves are emerging. So, in the future, avoid those products in lawns during leaf emergence. There were also some late cold snaps that likely impacted oak trees when leaves were ready to emerge. There’s nothing to do other than to water to avoid drought stress. All the trees I looked at are developing new growth; they’ll look more ‘normal’ in 10-14 days. The cold snaps may have also impacted apple and other fruit tree varieties that were in the pink/white bud stage or already starting to bloom, thus why some trees don’t have fruit.


Please take care of yourselves! Rural Wellness website: https://ruralwellness.unl.edu/ and Nebraska Rural Response Hotline: 1-800-464-0258.
JenREES 6/11/23

Last week I heard the following repeated themes:
- What are we going to do with dryland crops/pivot corners/endrows?
- I just keep lying awake at nights trying to figure out how to feed livestock. I need to sell cows.
- I’m exhausted and it’s only early June.
- I have no idea how I should be irrigating right now.
- This may sound crazy, but I’m thinking…
For the majority of us, this is unchartered territory for making decisions and seeking to advise. Yes, we’ve had drought before. The extra significance with this year is the fact that, for the majority of us in our lifetimes, we haven’t experienced this lack of subsoil moisture. As I continue to probe fields, non-irrigated subsoil moisture doesn’t often go below 8-10” into the ground and irrigated subsoil moisture doesn’t often go below 20-24”. We all know this; we desperately needed this past weekend’s rains which too many in the area didn’t receive.

With every challenge is opportunity, and for me, the opportunity here is learning. I keep listening to stories from older generations or those out west. Even those out west who experience drought shared that they usually have some subsoil moisture and corn often gets to at least waist tall before dying. Corn dying at ankle to knee high for us is very hard to see.
Consider talking with others. There may not be ‘right’ answers, but instead, making the best decisions we can with the information we have right now. We’re learning together.
Several mentioned trying to keep some armor (residue/plants with roots) on the soil to protect pastures which means getting cattle off earlier in spite of forage being tight. The hardest conversations have been around selling cows because that’s a livelihood and people have built up genetics.
For irrigation, the comment many of us shared was trying to get moisture down into the profile for later in the season as water levels continue to decline and with low capacity wells. Steve Melvin and team wrote a CropWatch article that shares additional thoughts: https://go.unl.edu/80w2.
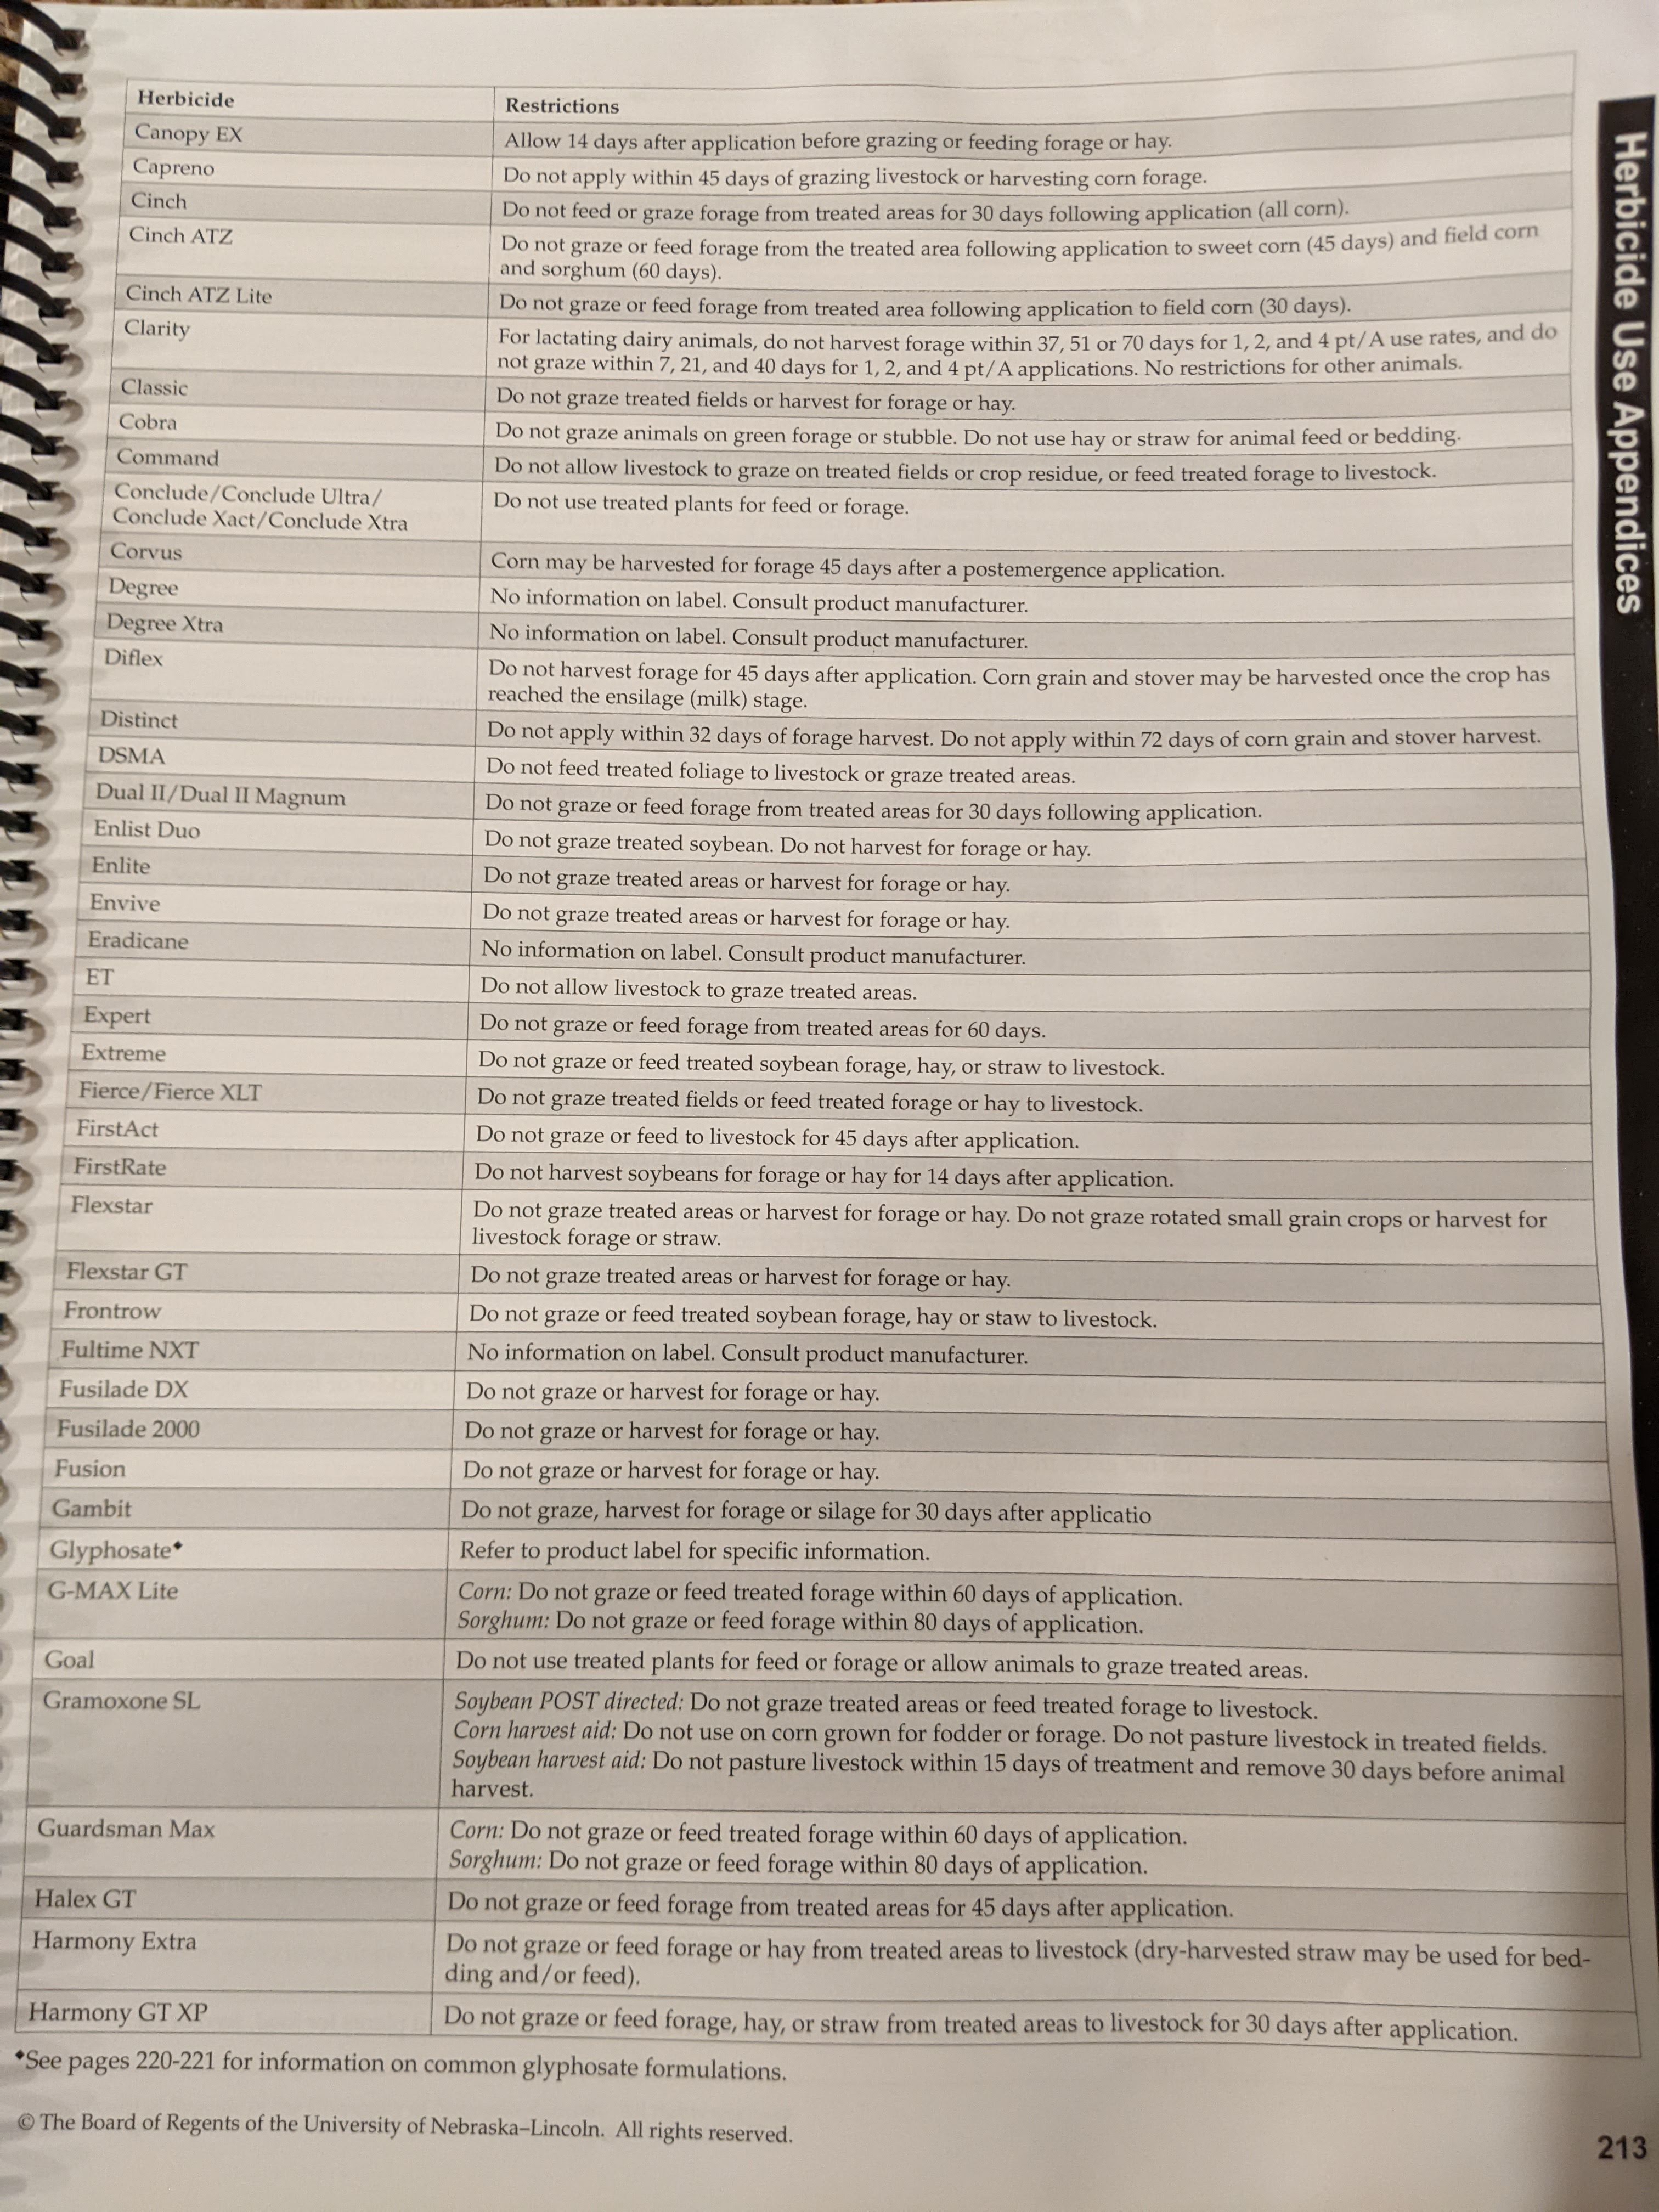
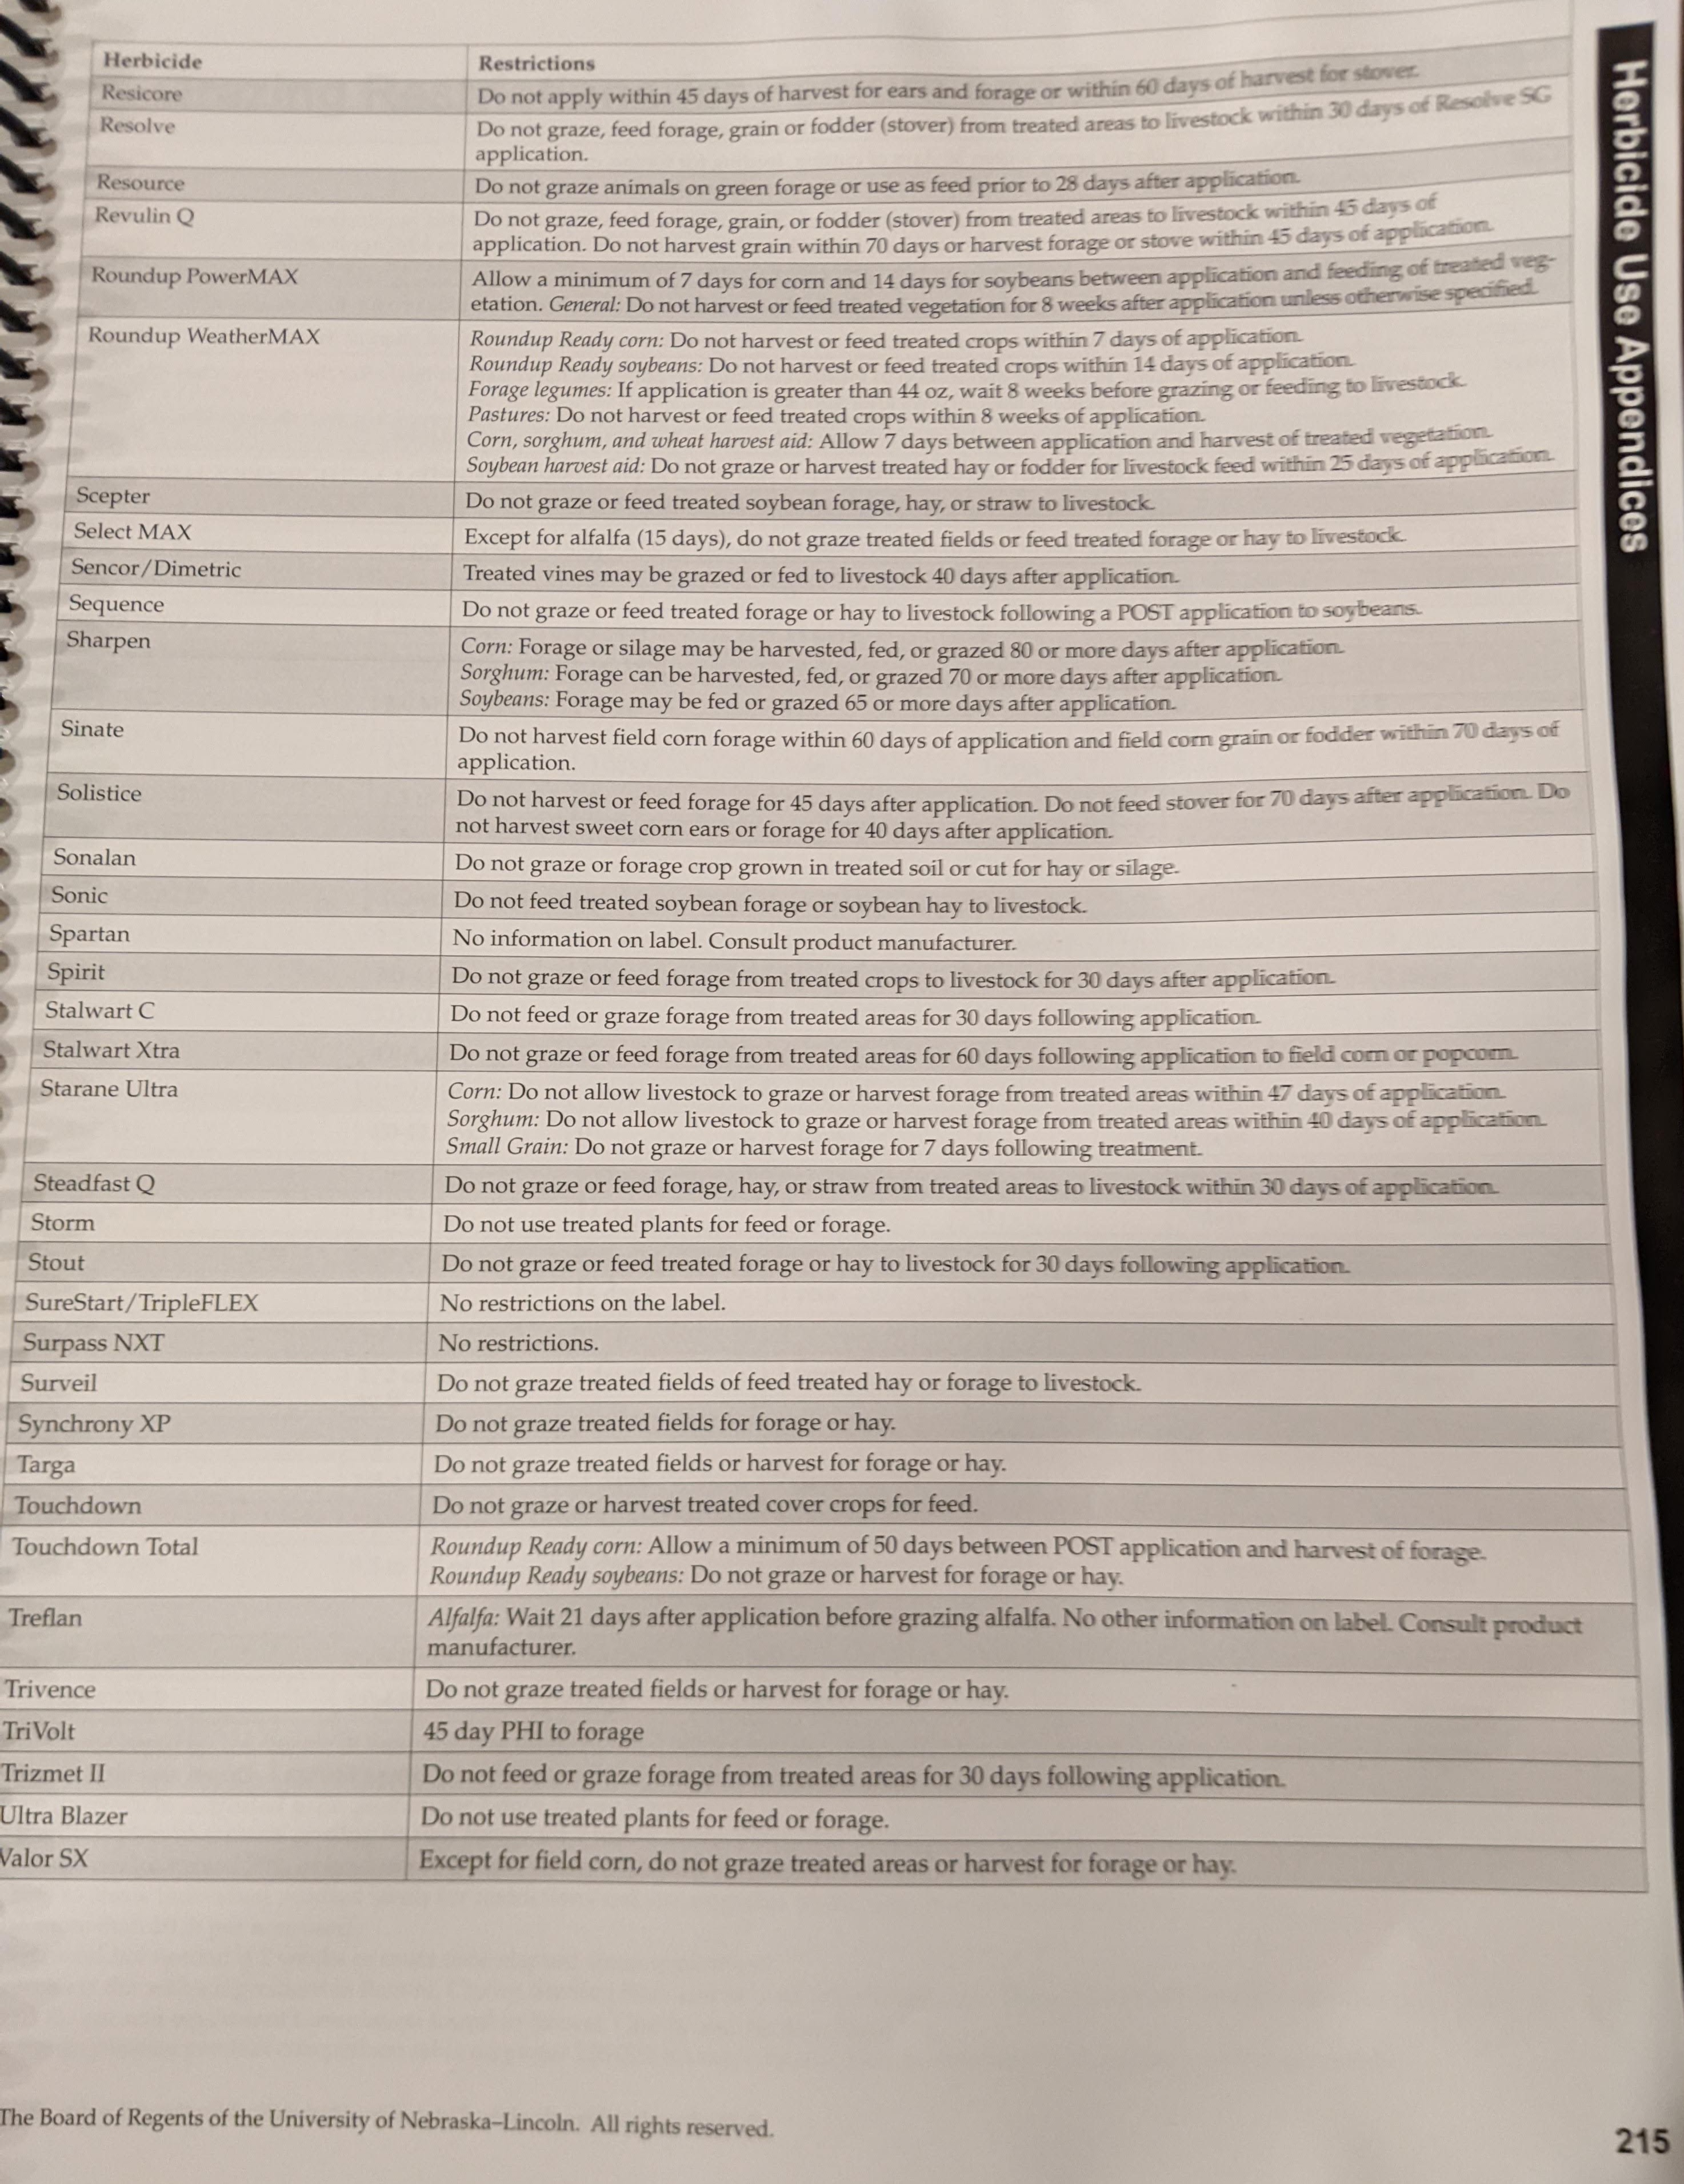
For non-irrigated crops, forage has been on my mind all year. Thus, why I wasn’t recommending full chem loads and side-dress nitrogen applications depending on the individual field situations. My thought has been these non-irrigated crops become opportunities for grazing where that’s applicable. There’s considerations first such as being released by crop insurance, waiting till the crops have died as today’s hybrids and varieties are more resilient than the past, and checking herbicide grazing restrictions (I have pics of those from the UNL Weed Guide on my blog). I’ve been talking to a lot of people about how to graze corn and soybeans or other options and will share in future weeks if we need to go there.
For those considering planting an annual forage species (sorghum or millet species) after non-irrigated corn and soybean (that died from drought), we need 4-6” of rain to germinate seeds and for some subsoil moisture as that profile would’ve been completely depleted from the previous crop. We may not have enough moisture till closer to August. In the meantime, would recommend checking herbicide plant-back restrictions and that you consider the opportunity for annual forage insurance. There’s upcoming workshops (Beatrice & Hastings on June 20) where you can learn more: https://go.unl.edu/ubyt.
By the end of last week, I realized I was doing a poor job of encouraging people and finding positives in situations. I needed a change in perspective. For me, I have nothing without my faith and renewing my hope in a much larger eternal perspective was necessary. It helped me to get away to a Christian concert festival with friends and family and to hear an encouraging sermon at church. What may help you may differ, but I’d encourage you to take some time to de-stress and seek encouragement through positive activities. Whether through your faith, spending time in nature, music, exercise, journaling, reading, woodworking, seeing friends, etc., be intentional to take time away with positive activities. Also rest. Brandy VanDeWalle also shared thoughts on drought’s impacts on people in her blog: https://vandewalleviews.com/2023/06/09/drought-impacts-on-people/.


JenREES 6/4/23

Drought discussions: Grateful for any rain that anyone received! It’s amazing how even a small amount of rain can lift moods. Drought isn’t a fun topic but sharing questions I’ve received the past few weeks.
I think part of the reason why irrigated ground in general also greatly lacks subsoil moisture is because we irrigated far later into the season than typical with the replant crops in addition to not getting precipitation for recharge. Our silt-loam soils can hold at least 2.2”/foot of moisture with around half of that (1.1”) readily available to the plants. Soil moisture sensors or probing fields can give you an idea what’s even available in the soil profile and provide the reality of how much we really need to recharge the profile at this point. Also, various colorations of yellow/purple/blue/gray corn are all indications of drought stress based on how long they continue to roll leaves or are struggling to transport water and nutrients. Some hybrids have more of a purpling tendency upon stress due to their genetics.
Drought stress during V5-V8 corn can impact rows around on the developing ear. Hard, dry surface ground can also impact brace root development. In soybeans, stress right now makes the plants shorter and roots deeper. Iowa State showed a chart that when corn is drought stressed for four consecutive days from V1-V12, an estimated yield reduction of 1-3% per day is possible.
I think the discussion more than yield right now is how long/if these non-irrigated crops will survive. Some are hoping they can survive long enough to obtain any type of forage. If we don’t get rain, things are looking pretty bleak past potentially next week.
So what to do? For those with poor stands I’ve been advising to wait and see if we get rains by the federal crop deadlines. I’ve been asked by some if crop insurance will require replanting poor stands. In talking this through with someone in crop insurance, it sounds like they’re also recommending people to wait for now and replant won’t be required if we don’t get rains, because we have no surface moisture to germinate anything. He said they have allowed for replant in parts of the state that had some good recent rains but it’s really a case by case basis with as spotty as the rains have been. Many are concerned about weed control going forward, especially after our palmer problem last year. Without rain, we can’t activate chemical on these non-irrigated fields, so I don’t have good answers right now. We’ll have to see what happens.
Thinking about POST- herbicides and weed control, I’m late in sharing this but had several conversations the past 10 days. Most with non-irrigated fields weren’t throwing the whole load out there but instead some type of contact herbicide to burn down weeds present and wait and see what happened with rain. This was due to concerns over not having rain to activate residual, keeping options open if the current crop is destroyed and a forage crop could be planted later in the year, and concern over small, stressed corn/soy having to deal with a large chem load. We recommend residual products receive at least 0.5-0.75” within 5-7 days of application to activate them. Sometimes we can still get some activation with certain products up to 14 days after application, but from what I’ve heard from chem reps and weed scientists, that’s the max we can hope for.
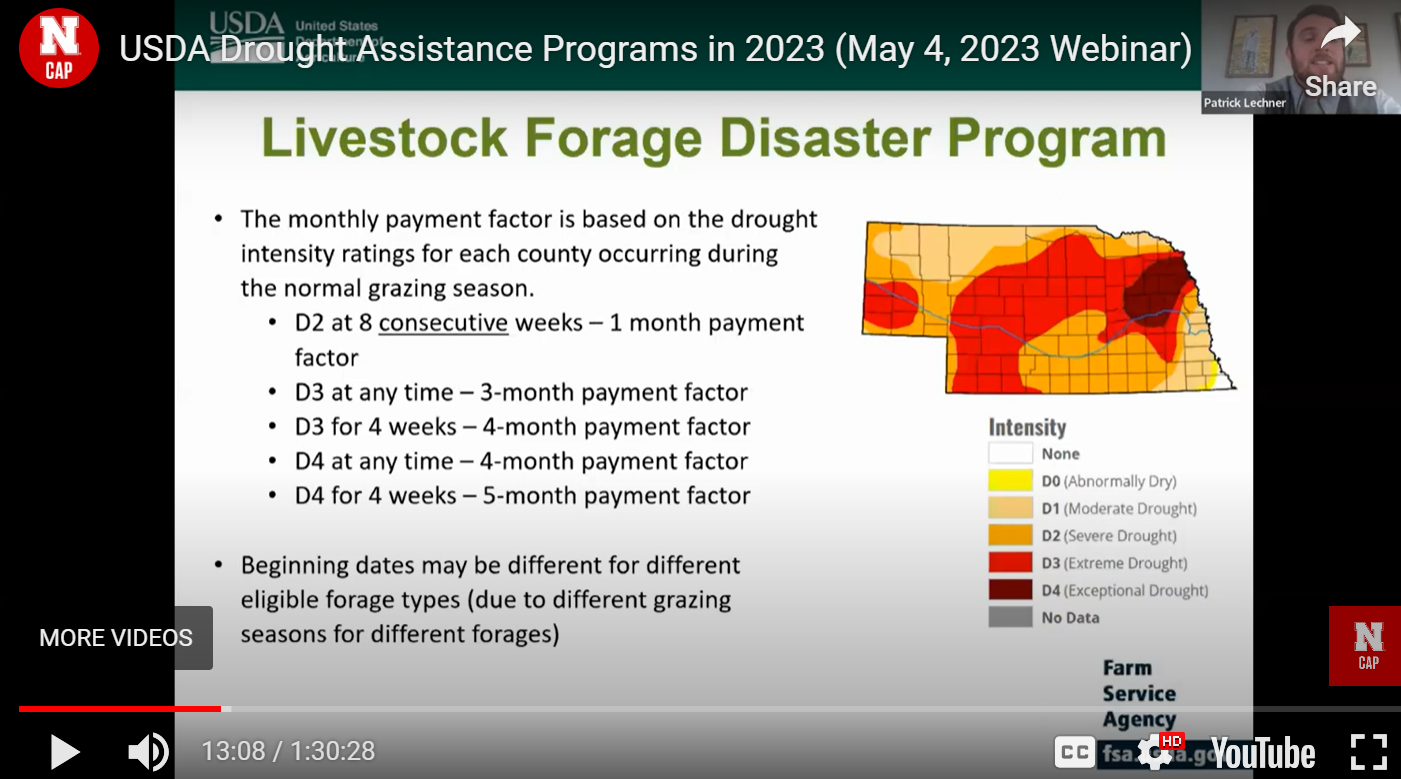
Re-sharing this webinar on drought assistance: https://go.unl.edu/r24y. I also added a key graphic to my blog that shows when the livestock forage disaster program kicks in. It’s based on the drought monitor and it’s all triggered by county, not where the “line” is drawn in counties between drought designations. Most of the counties in this area of the State have now triggered D4 so the program kicks in for a 4 month payment factor. When a county is in D4 for 4 weeks, the payment factor increases to 5 months. There are several programs within USDA drought assistance including helping with feed and water transportation costs and for those who’ve had to sell off livestock. The webinar does a good job going through the programs and answering questions. You can also contact your local Farm Service Agency office with questions.
Final thoughts, in spite of how weary people are of irrigating and the craziness of having to lay pipe just to get plants going, I think most still feel blessed if they have irrigation. The corn in irrigated fields changed from the ‘ugly duckling’ stage to the pretty green stage this week and corn likes the day/night temps we’ve had. We will keep praying for rain and it will come in time!
JenREES 5/28/23

This time of year, when flags start lining the streets in towns, it’s always such a beautiful site to me. I also like visiting different cemeteries to see the veteran’s memorials and the flag displays. On Sunday, the way the large number of flags were unfurled in the wind at the cemetery in Utica was breathtaking…to the point on HWY 34, the two cars in front of me and I all hit our brakes and drove by slowly to take it in. Scenes like that or a beautiful rendition of the ‘Star Spangled Banner’ will always get me. I’m so grateful God allowed me to be an American; I don’t know why He allowed the life I’ve had vs. others in the world, but I’m grateful. I’m grateful for the service members throughout history and to those who made the ultimate sacrifice so our Country could remain free. I’m grateful to their families for the sacrifices made, especially those left behind. In spite of everything going on in our Country and the world, and in spite of how differently people view freedom, we still are so blessed to live in this Country! So this Memorial Day, as we spend time with family and friends, as we remember and honor loved ones who have gone before us, may we also remember and be grateful for those who paid the ultimate sacrifice for our freedom, those families left behind, and may we keep praying for our Country and leaders, military members and their families.
Drought: One thing I was grateful for this week was, in general, the lack of high winds and high heat with as dry as it’s been. Heat and wind would make this situation even more difficult. I was also grateful the Drought Monitor acknowledged we needed to be moved into D4 and expanded the D3 area. These designations are important, particularly on the forage and livestock disaster assistance and insurance side. There’s many conversations that occur behind the scenes each week. Whenever I feel we can get a designation that better reflects our situation, I’m grateful. Special thank you to those who share info. on what you’re receiving for yields on alfalfa cuttings, pond, and pasture situations. Your input greatly helps me put together a better picture for those making decisions to consider. I share what I’m seeing but having specific info. from producers to share always helps. Others are welcome to share with me as well if you’d like!
USDA FSA with Nebraska Extension held a drought assistance programs webinar earlier this month. If you missed it and wanted to learn more, you can watch the recording here: https://go.unl.edu/r24y.
Regarding releasing of wheat for forage, several were also concerned about the potential for high nitrates. What Dr. Mary Drewnoski has observed through her research, demonstrations, and what we’ve seen with producer situations, is that yes, forages often test high in nitrates, but these immature small grains are also high in quality. She has found high quality and high energy help to off-set high nitrate danger. The following NebGuide walks through nitrate situations and considerations: https://go.unl.edu/bjdf.
Several also had conversations with me about pasture turnout. Some are turning out now/shortly with the goal of getting cattle off by mid to late-June. Others are hoping to graze/feed wheat or alfalfa first and then turn cattle out to pasture in June. Regardless, with short pastures, we need to think about pasture management too, even if we do get some rain. And, with pasture management comes thinking about potentially altering pasture leases.
Insects in Crops: Link to article on scouting emerging corn for insects: https://go.unl.edu/pg2c and light trap data for stations throughout the State: https://entomology.unl.edu/fldcrops/lightrap
Birch and other established trees: Trees that prefer moist soils, like some river birches, have branches that died down from the top. Sometimes only half the tree is leafed out. Young birch trees may be forgiving and recover if the dead is pruned out. As we think about established trees (birch or other species), lawn irrigation can be enough for established trees in our area in ‘average’ rainfall years. But with the drought stress, consider using soaker hoses and bark or wood chip mulches to help keep the root zones of trees cool and moist. When watering, moisten the soil 8 to 10 inches deep for trees (push a screwdriver in the ground to determine depth of moisture). Don’t overwater! Only apply 2-4” deep of bark mulch around trees and avoid placing mulch next to the tree trunk as that can create rotting of the trunk. Also don’t fertilize stressed trees.

JenREES 5/14/23


Dry Conditions: Grateful with those in the State who received rain last week! And, continuing to pray that we all might receive rain. It will come again in time. I’ve had a lot of conversations about drought with people this year. Many think back to 2012 as the great drought year, which it was that summer-winter. But actually, I don’t remember a year where in taking soil samples I’m not seeing subsoil moisture past 15-20” deep, even in irrigated fields. That may not be the case in every field, but it’s what I’ve been finding commonly this spring in this area of the State. It’s concerning.
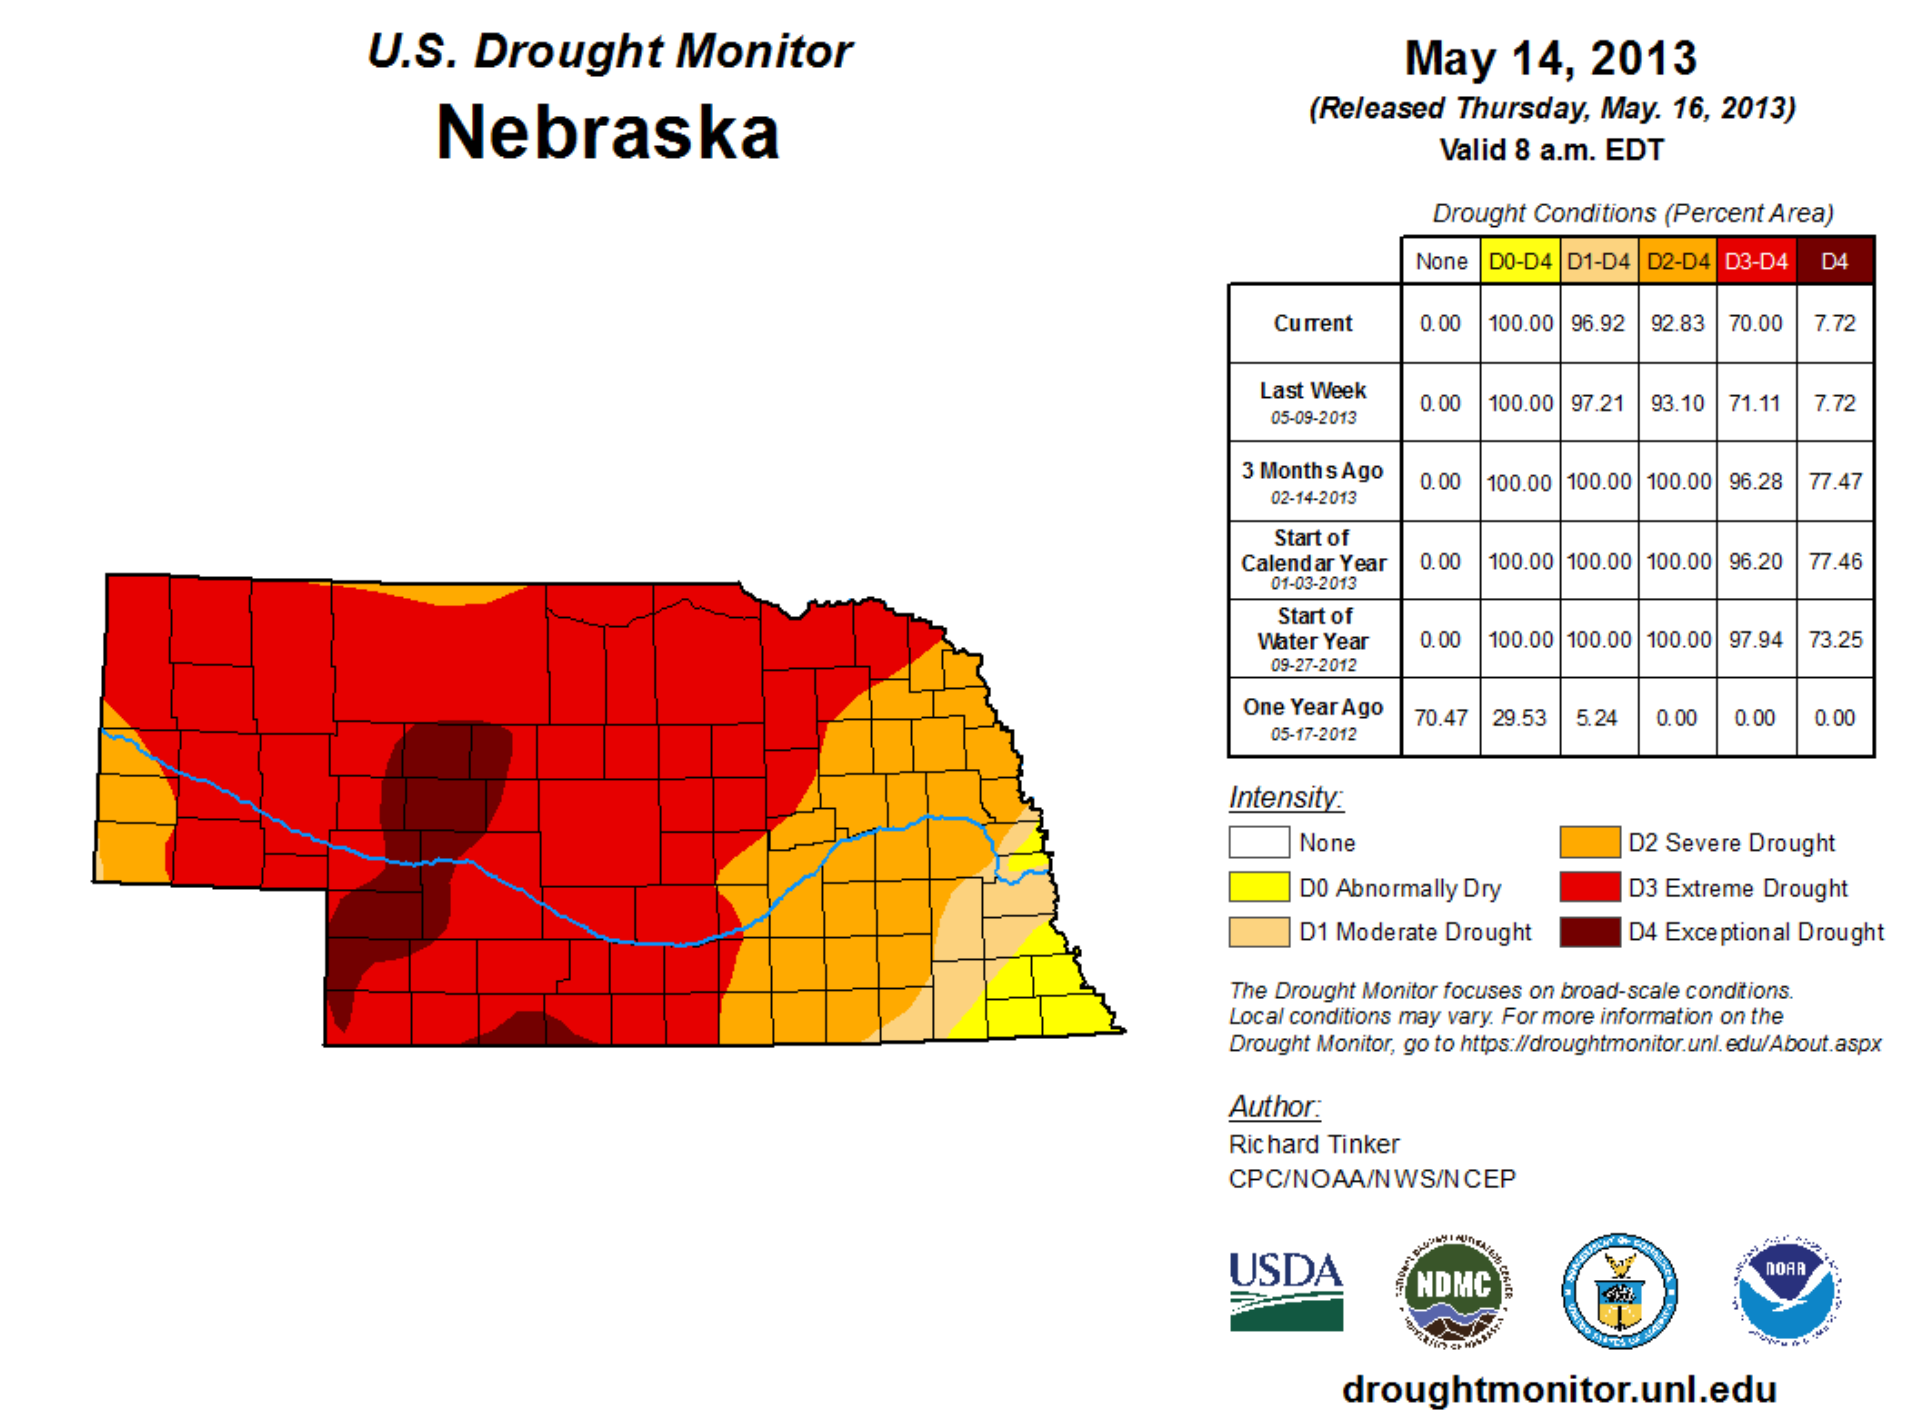
We went into 2012 with subsoil moisture in this part of the State, and I remember the dry surface conditions led to good planting weather and the spring-flowering plants were early. The Spring of 2013 lacked a full soil profile compared to the Spring of 2012 (similar to Spring 2023 to 2022). To visualize this, I pulled up images from the Drought Monitor. The May 15, 2012 map showed only 5.2% of the State was in D1-D4 drought (and technically, nothing was over D1, which is considered ‘moderate drought’). In contrast, one year later, the May 14, 2013 map showed 96.9% of the State was in D1-D4 drought. I also pulled up the May 9, 2023 drought monitor map. It shows 98.99%…so essentially 99% of the State is in D1-D4 drought. The 2013 map technically shows the drought was worse this time of year for the majority of the State, particularly western NE. 2023 shows the eastern part of NE suffering more than it did in 2013.
Ammonia Burn: The dry conditions are leading to some ammonia burn to corn seedlings. Cold and dry conditions, both of which we’ve had this year, can lead to the ammonia burning the radicle (first root emerging from the corn seed), other roots (leading to a ‘stubby root’ appearance), in addition to sometimes causing damage to the coleoptile (first true leaf). Emerged plants can look stunted and wilted in appearance. We were anticipating this could be a problem this year, particularly if at least 2″ of precipitation (we may have needed more than that) wasn’t received from time of application to seed germination.
Ammonia impacts up to a 4” radius in the soil from where it was injected; it can expand beyond this into a more vertical or horizontal oval shape depending on soil texture, moisture, and how well the band sealed. Thus, in a dry year like this, ammonia placed at 4” deep and below the seed zone can impact seedling germination and emergence. Ammonia placed deeper (6-8″) often doesn’t impact seedling germination and emergence unless there wasn’t a good seal or soil conditions change allowing ammonia to move back up the knife track. For example, if the soil dries after application allowing the knife track to open as it dries, ammonia can move towards the soil surface allowing for seedling injury in spite of the deeper application. One can also see ammonia burn later (V2-V5) from ammonia placed deeper if the conditions remain dry as roots hit the application zone and the ammonia hasn’t converted to nitrate. As much as it stinks, for those experiencing ammonia burn in fields, the only thing we can recommend is to irrigate and evaluate plant stands. For non-irrigated situations, some talked about applying anhydrous at an angle or to the side of the corn row to help reduce the number of plants that may experience ammonia burn, so hopefully that has helped.
John Sawyer from Iowa State University cited an Illinois study that shared the concentration of ammonia, “The highest concentration of ammonia is at/near the point of injection, with a tapering of the concentration toward the outer edge of the retention zone. Usually the greatest ammonia concentration is within the first inch or two of the injection point, with the overall retention zone being up to 3-4 inches in radius (as an example, with 120 lb N/acre applied early April at Urbana IL, the ammonium-N concentration in mid-May was at approximately 700 ppm at 0-1 inch, 300 ppm at 1-2 inch, and 25 ppm at 2-3 inch from the injection point).”
Evergreen Trees and bushes: Evergreen trees (especially white pine, arborvitae, junipers) and bushes (like boxwoods, Japanese Yew) continued to respire (lose moisture) all winter. May-June is the time we start seeing browning due to winter desiccation. While they look bad, wait to prune out brown/dead material till at least late May-June. As I showed a homeowner this week, a number of buds may still be developing on these brown stems and it’s best to see what will recover first.
Livestock Custom Rates: Many use the crop custom rates from UNL that are published every two years. The Ag Econ group is putting together a Livestock Custom Rates. If you’re willing to help them with this, please go to this link: cap.unl.edu/customrates/livestock.
JenREES 12-13-20
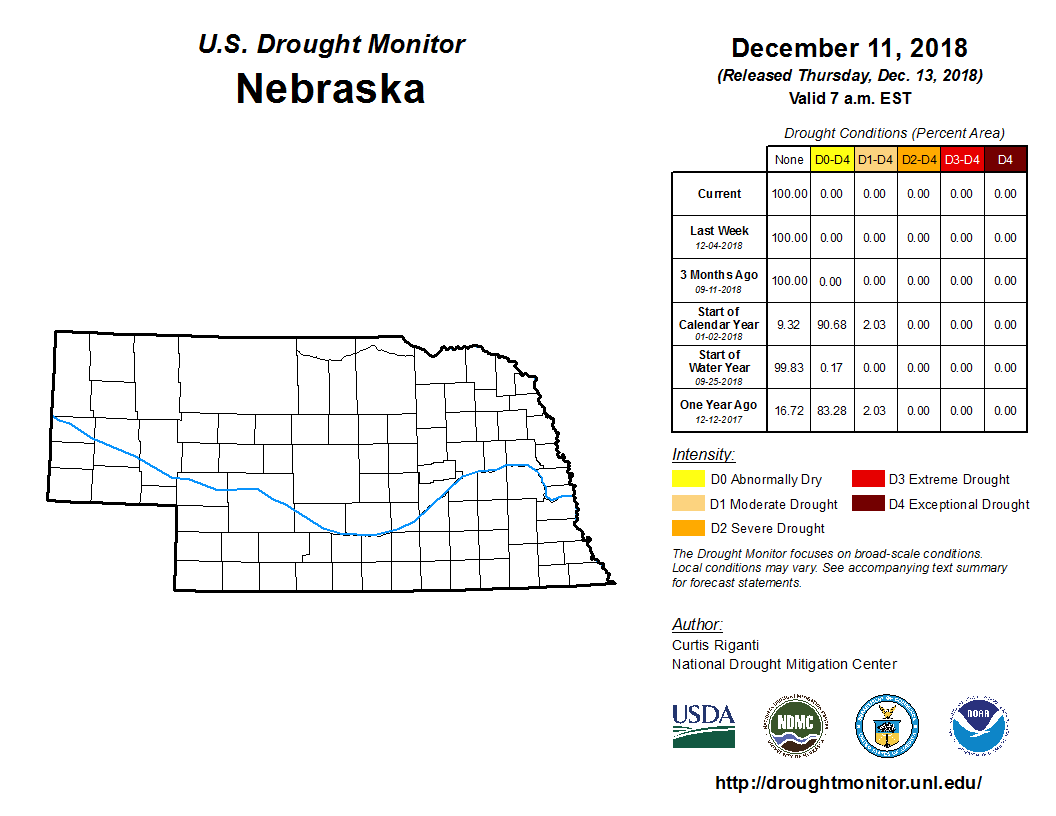
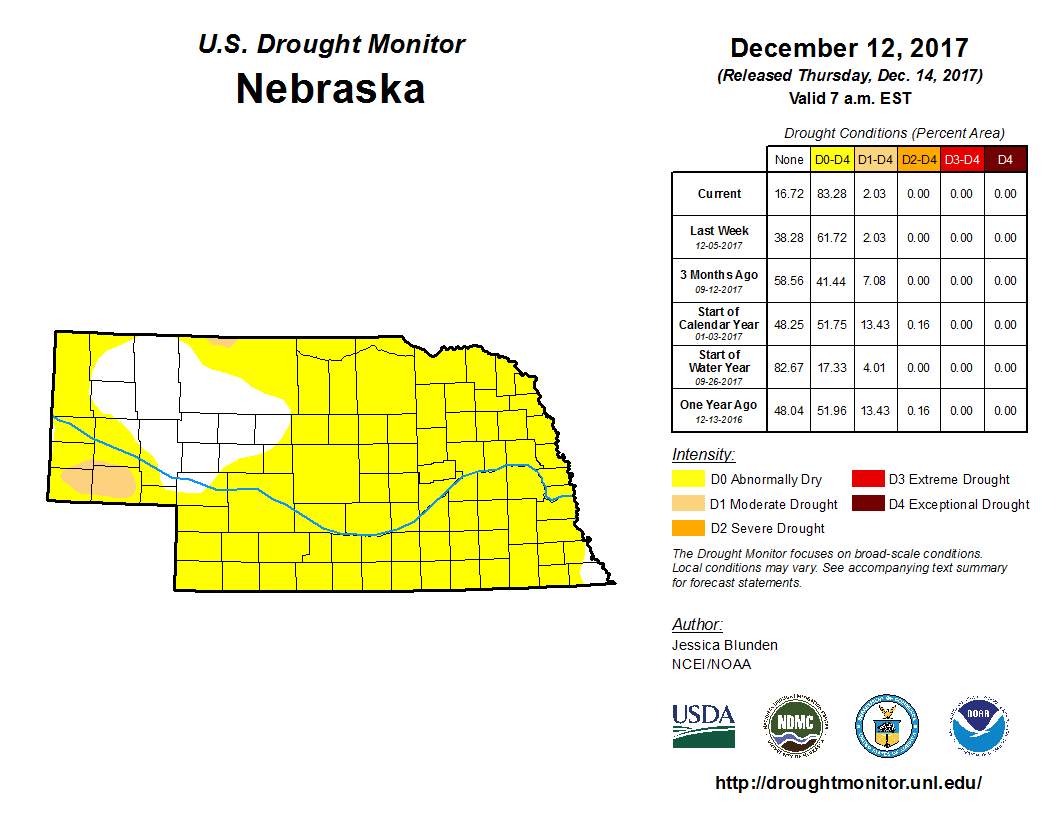
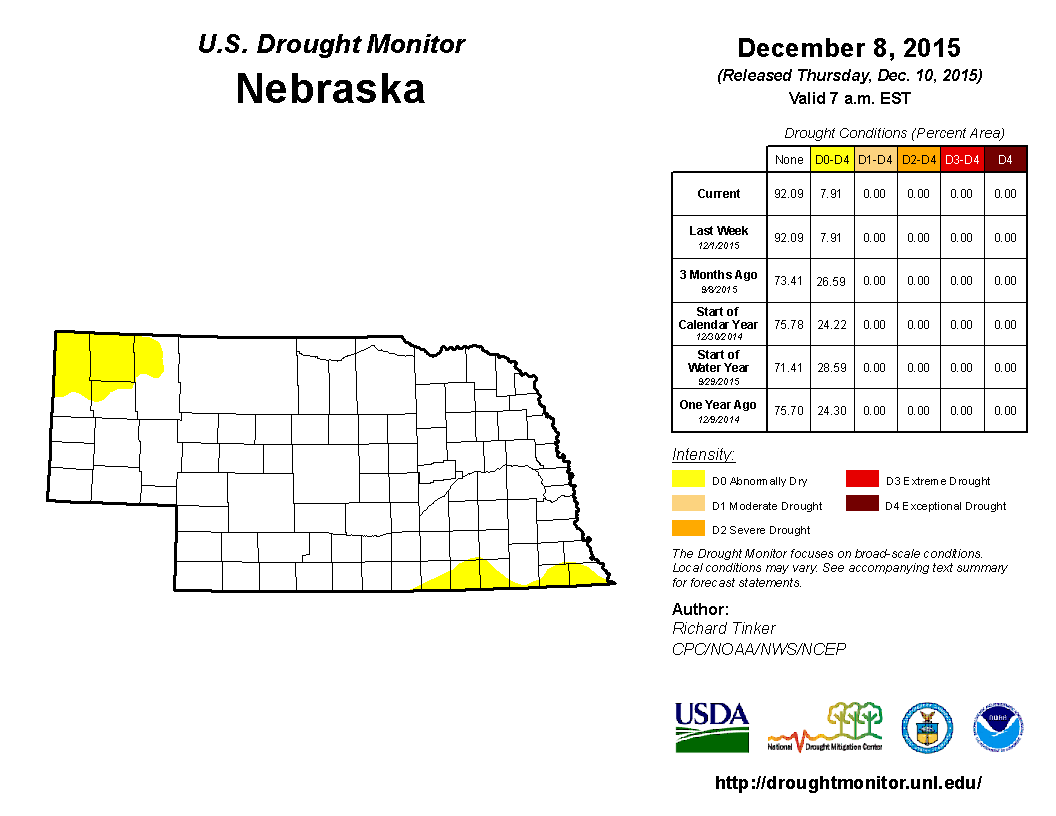
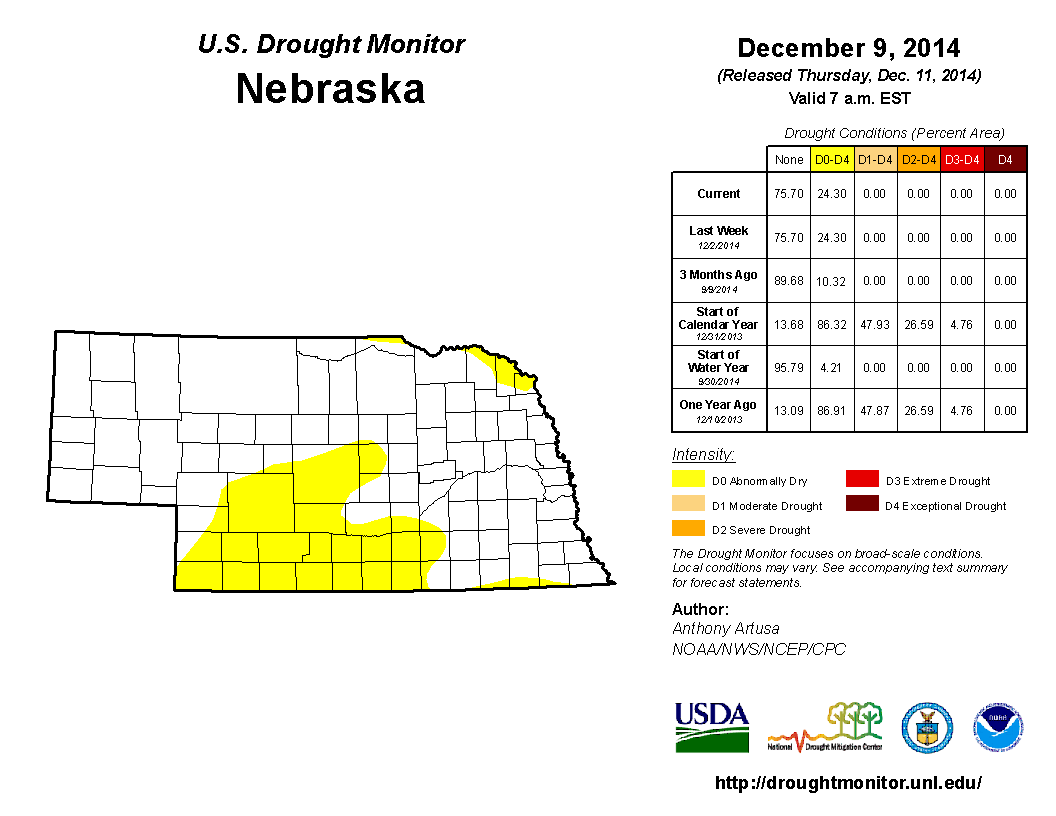
The sun glistening on the snow holds such beauty after a warm, dry beginning to December! Moisture is very much needed! For curiosity sake, I looked at the Drought Monitor for this past week and compared it to the same week in previous years. The pics are shared at jenreesources.com and it’s quite interesting comparing and thinking back through the years. Hopefully we can receive more precipitation prior to planting season.
If you missed it, the Farmers and Ranchers College program featuring Dr. David Kohl and Eric Snodgrass can be found for 30 days at: https://www.youtube.com/watch?v=9cFKs13i_Ak. I appreciate how Eric shares global weather and climate information in an easy to understand way! He also shared an interesting story of how El Nino is related to the Christmas season, so you’ll have to watch the recording to learn that. Some stats he shared for the State of Nebraska: June was the 18th driest on record followed by the wettest July on record. That was followed by the driest August on record with September as the 18th driest on record (would have been driest but thankfully we received precipitation after Labor Day weekend). He looked at weather data from 1901-2020 for Nebraska and the U.S. which showed a trend of 2.5” precipitation gain from April-October (with higher gains as one goes east in the U.S.). He also looked at the past 40 years which showed heavy rainfall events (more than 2” per event) has tripled.
There was an effort my colleagues began a few years ago called “Weather Ready Farms” https://weather-ready.unl.edu/. It was designed to improve or increase resilience towards the impacts of extreme weather on Nebraska’s farms. A number of things go into that with some examples at the website. A few examples of things farmers have done since the 2012 drought and the 2019 floods include keeping the ground covered with residue and cover crops to help reduce evapotranspiration, increase water infiltration, and reduce wind/water erosion as we experience these more extreme events.
BeefWatch Webinar Series is designed to highlight management strategies in grazing, nutrition, reproduction, and economics to increase cow/calf and stocker production efficiency and profitability. More information and registration for the BeefWatch Webinar Series can be found at: https://beef.unl.edu/beefwatch-webinar-series. Dates are January 5, 12, 19 and 26 with each webinar beginning at 8:00 p.m. CST. The focus for January’s webinar series is “Preparing and Managing for the Calving Season”. Jan. 5: Preventing calf scours (Is there a way to reduce the likelihood of calf scours without adding additional vaccines or other cash expenses to your current program?)
Jan. 12: Calving tool box and record keeping (favorite tools and tricks for smoother season)
Jan. 19: Calving complications and when to call the vet
Jan. 26: Cow nutrition needs at calving and in early lactation
Poinsettias: Kelly Feehan shares the following, “It’s Poinsettia time. Hard to believe these bright, colorful plants originated from a weed. And amazing what plant breeding and good marketing can do. To enjoy your Poinsettia as long as possible, place them in an area with bright sun for at least half the day. If possible, provide a night temperatures in the 50’s or 60’s. This is often the most challenging condition to meet in the home, but keep plants as cool as possible at night. If plants are near a window, don’t let the leaves touch cold window panes; and keep Poinsettias away from warm or cold drafts. Poinsettias need to be well-watered. Because they are in a light weight soil-less mix, they will dry out quickly. Allow the soil to dry slightly between watering; then water thoroughly until water runs out of drainage holes. Be sure to punch holes in decorative foil wraps to prevent soggy soil conditions or at least pour excess water out of the foil after each watering.”