Category Archives: Discussion Topics
Fertilizer Prices
The heat and sunshine are rapidly drying out grain! We have a number of harvest safety resources in this week’s https://cropwatch.unl.edu. Here’s wishing everyone a safe harvest!
Fertilizer input costs is another topic farmers have been sharing with me about. Farmers will realize the cost of nitrogen inputs are higher than this time last year. An article in Farmdoc Daily from the University of Illinois shares, “Prices in the first week of August averaged $786/ton for anhydrous, $594/ton for urea, and $431/ton for liquid nitrogen. These prices are 6%, 10%, and 20% higher than those reported for the first week of August in 2024….
Relative fertilizer prices provide another important perspective. The ratio of anhydrous to monthly national cash prices for corn reported by the USDA is also included in Figure 1 (right axis). In calculating the ratio, the anhydrous price is converted to dollars per pound of nitrogen based on the average N content of 82%. For example, the latest anhydrous price of $786 per ton is equivalent to $0.48 per pound of nitrogen ($786/(2000*0.82) = $0.48).

The relative price measure (anhydrous to corn price ratio) has followed a similar path to fertilizer price levels since the start of 2020. Relative nitrogen prices peaked at the end of 2021 with a ratio of 0.17. Since the fall of 2023 the ratio has varied around the current level of 0.11. Also similar to absolute prices, the relative price of fertilizer in the past few years has been above longer run averages (average ratio of 0.09 from September 2008 through 2020).”
The authors suggest, “Forward pricing, volume discounts, and varying the timing of purchases and applications are strategies that can be used by farmers to control costs and the risks associated with fertilizer price risk. Farmers are advised to collect pricing information from multiple sources and consider their application rates given the ongoing cost-price squeeze.”
A number of farmers the past few weeks have shared frustration with the input cost prices compared to the crop prices in anticipation of next year’s crop season. Several farmers have asked about how to make their nitrogen more efficient. I don’t claim to have all the answers.
One farmer was looking at numbers and shared frustration over the current fertilizer pricing structure. He looked at where he could be if he became more efficient by 10% over 10 years. Seeing that savings, he asked a question, if farmers in general would become 10-25% more efficient over 10 years, resulting in reduced demand, what would that do to the fertilizer market? And, how could that help with groundwater quality for future generations?
With all these conversations I bring up Sentinel Ag. While no technology is without challenges, based on the research, the main way forward for increasing fertilizer efficiency is to apply less pre-plant nitrogen and use in-season sensing technologies to apply only what the plant needs. That is the point of my Nitrogen Challenge: For farmers with irrigated ground, apply 70-100 lbs N/ac pre-plant. Farmers with non-irrigated ground could apply 50-70 lb N/ac pre-plant. Use a sensing technology like Sentinel Ag to apply the remainder of the in-season nitrogen. There’s options to apply in-season nitrogen via fertigation and also side-dress. I was also asked, “What holds farmers back from using fertigation or from applying nitrogen in-season?” So, that’s a question I will ask you in this one-question poll, and I will share the answers next week: https://app.sli.do/event/bWh8PhzaqsPWRvwweB5YTp.

Life is Not Guaranteed
Last Tuesday night was our first Farm Succession Program “Leaving a Lasting Legacy”. That night was an incredibly impactful night for me. We heard from two women who became widows in their 30’s with young children. They were incredibly courageous in sharing their stories of loss, grief, difficulty navigating bills and decisions, etc. I left that night with so much on my mind. My husband and I have talked much since then. I’ve also shared with my siblings as we talked through how would our next of kin be able to navigate our accounts, passwords, etc. if something would happen to us.
The ladies shared several things that I felt would be beneficial to all for me to share here.
- At minimum, have a will in place that shares your desires for who receives your belongings, guardians for your children, etc.
- All vehicles and property should be listed as “joint tenancy with right of survivorship”.
- Both widows nearly dealt with probate. One widow lost both her father and husband in a plane crash and both were part of the family dairy business. The trust had been started but never completed by the father. They were able to avoid probate on the things the father had in the part of the estate plan written down but are still paying hefty fees on the parts that weren’t written in order to keep the family business. She emphasized the importance of finishing estate plans!!! Then review them every 2-3 years.
- In the case of the other widow, the husband had an off-farm job as a life insurance agent in addition to the farm. She shared the blessing of how well he provided for her by having such a large life insurance policy that helped her pay off debt and keep/manage the farm while raising her children at home.
- All accounts need to have both people listed. For example, the family phone plan was listed under the husband. She wasn’t able to access it with the phone company since she wasn’t listed and had to start over with new phones and accounts.
- The husband’s work email was used for several accounts at home (electric, heat, etc.). When he passed, his email was discontinued and the wife had no access to the accounts, nor was she listed on them. They both shared the difficulty paying bills and keeping their homes because they weren’t listed on accounts, on top of the immense grief they experienced.
- Ensure all account usernames and passwords are in a place where your next of kin can access them. There are tools for this including Nokboxes from Dave Ramsey.
- Medical: Many lawyers have templates for this, but if not, one document tool (paper or digital) you can use is from 5 Wishes. One wife whose husband was non-responsive had no idea if he would want experimental drugs used, if he wanted to be on dialysis for the rest of his life, and then if he wanted to remain on life support. She shared how having to make those decisions for him still haunts her, especially discontinuing life support.
There’s so much more I could share. Life is so short. Tomorrow, our next moments, nothing is guaranteed. My hope is that this column creates conversations amongst loved ones. Do you and your spouse/next of kin have a will in place? Do you have access to each others’ bank accounts, have a place where usernames/passwords are stored, have the names necessary on all accounts?
If you’re interested in attending, we will still take people each Tuesday night for the next three weeks. Please contact the Extension Office closest to you if you’re interested. More info: https://wia.unl.edu/succession25/.

Rethinking Crop Rotations
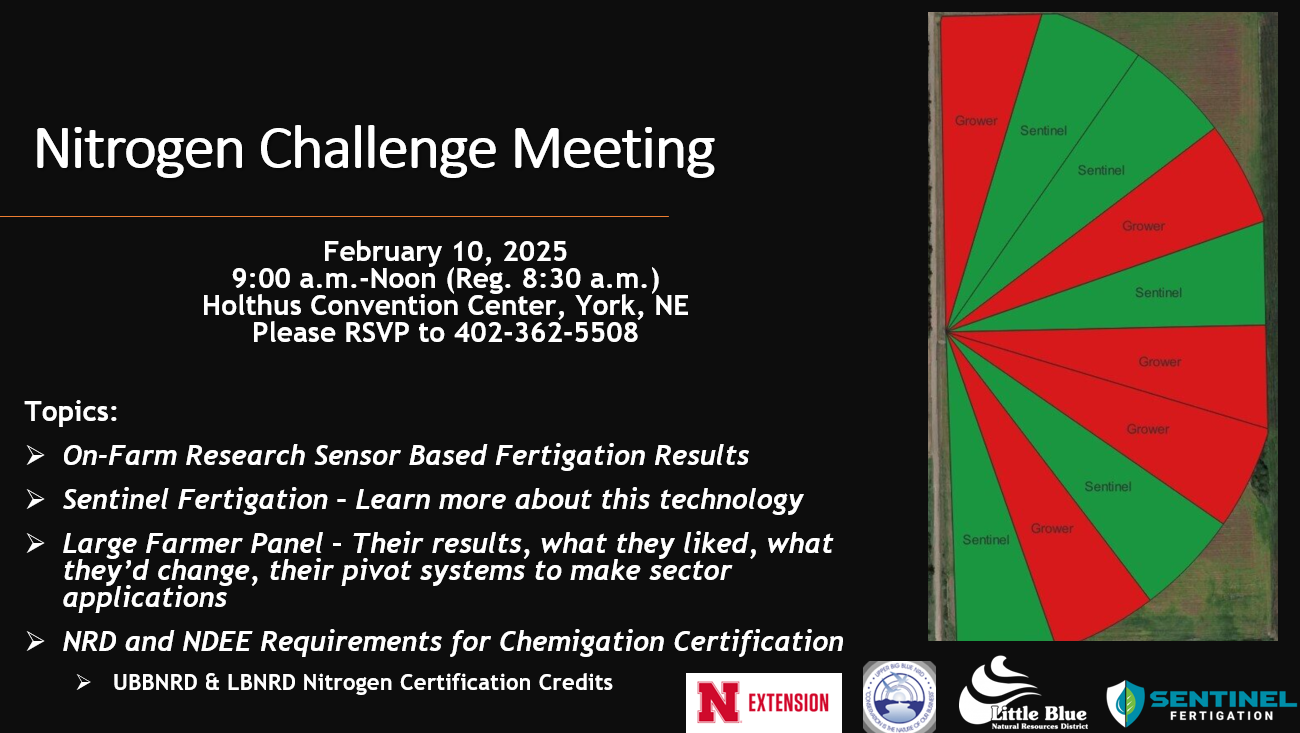
Thank you to all who attended the nitrogen challenge meeting last Monday, to all the presenters and farmers who shared their experiences, and to those who are choosing to join me in the challenge! A lot of great information was presented that day. The following is a snapshot of the combined on-farm research data using sensor-based fertigation via Sentinel Fertigation across 13 locations:
- Grower: 255 bu/ac yield with 195 lb N/ac applied, NUE of 0.77 lb N/bu, $1152.54 profit
- Sentinel: 253 bu/ac yield with 138 lb N/ac applied, NUE of 0.56 lb N/bu, $1177.89 profit
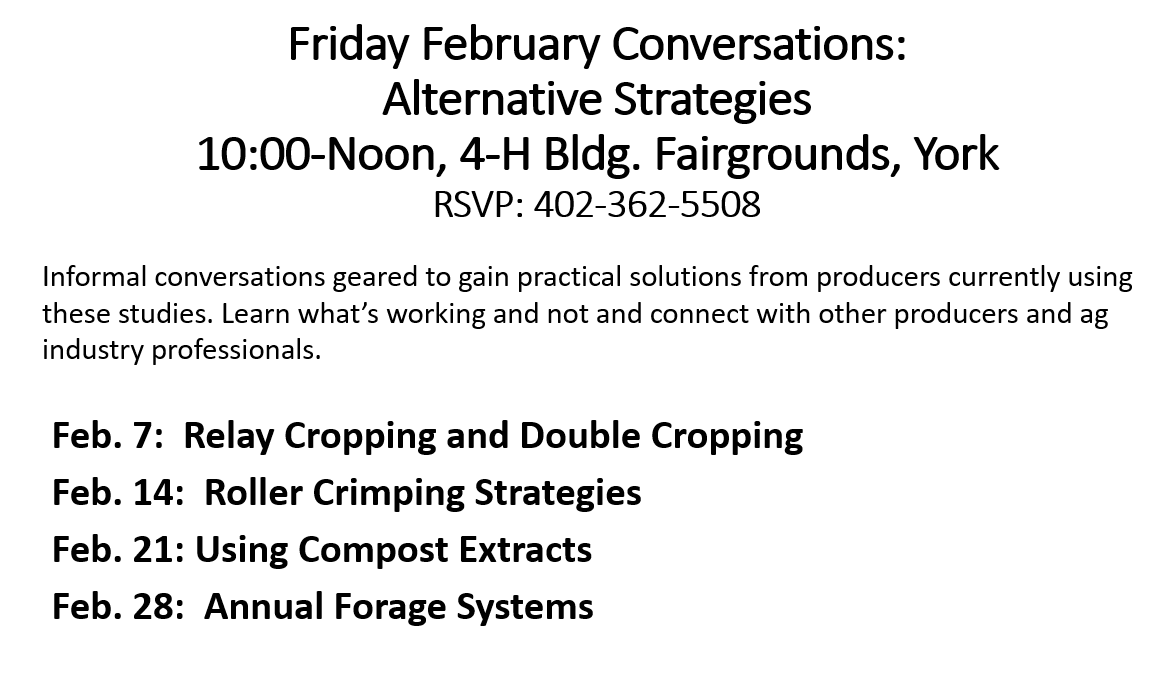
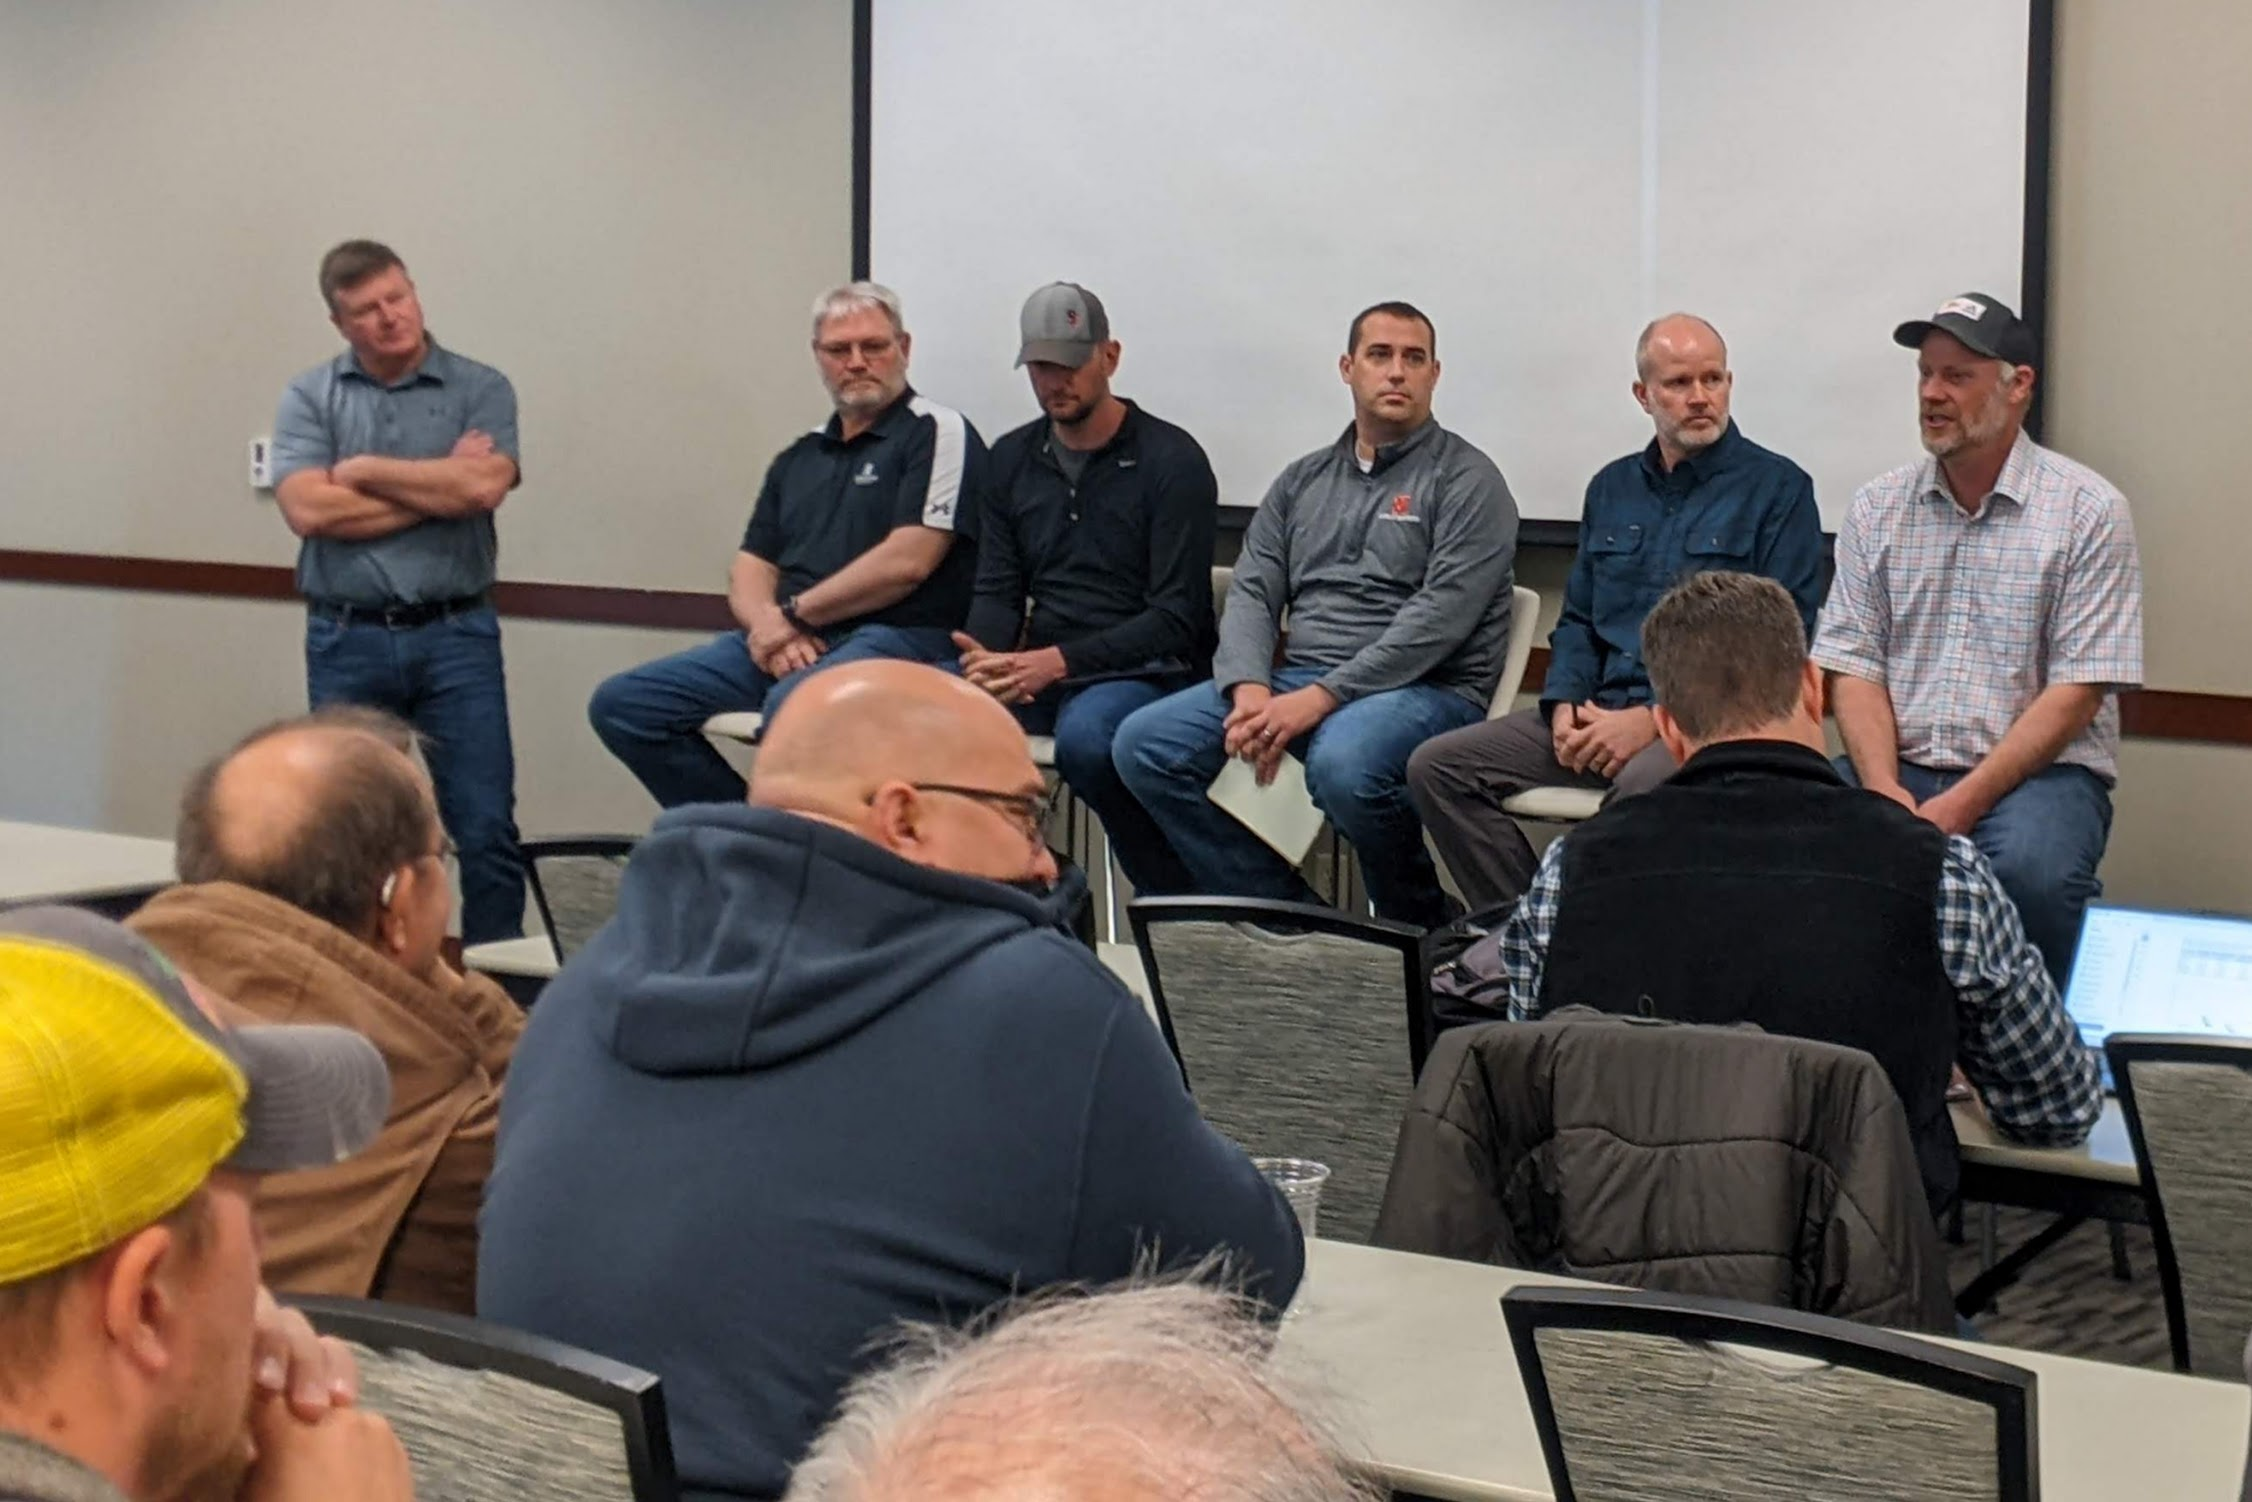
Crop Rotations: Appreciate those who attend the Fridays in February Conversations! We had a rich discussion on the topic of crop rotations and I appreciate the ideas brought forward by growers. We unfortunately didn’t have industry representation. I’ve heard frustration from some farmers raising seed corn with palmer, tracking up fields, low soybean yields and soybean disease issues. A handful of farmers have told me they recently gave up seed corn because of these challenges. Both seed corn and soybeans are important crops to our area of the state, so my hope was to discuss potential solutions. Small grains are also mentioned often below to help with pests, which can take looking at economics over years.
- Requiring extra communication and planning for isolation is to consider a 3-year rotation of seed corn/corn/soybean to allow for more carbon in the system and a longer rotation from soybean.
- I suggest a small grain before and/or after soy to help with erosion control, palmer control, and reduction in soil-borne pathogens impacting soybeans. Research from K-State showed significant reduction in palmer biomass when using either oats or wheat without the use of a residual herbicide (and with residual too). Rye wasn’t in that study; it helps significantly too.
- Red light on bare soil stimulates palmer/waterhemp germination. Keeping the soil covered with residue, cover crops and/or residual herbicide helps. Planting soybean green to allow for more cover crop biomass before termination is helpful (have to consider soil moisture).
- Oats is the best way to reduce soybean cyst nematode and sudden death syndrome in soybean. All small grains help but oats is proven to be the best for reducing those soil-borne pathogens. Planting either spring or fall helps and is an option for those who don’t want an overwintering small grain.
- Cover crop hosts for Sclerotinia sclerotiorum that causes white mold in soybeans include brassicas (turnips/radishes/collards). So, if the field has a history of white mold, consider adding a small grain (oats/rye/wheat) in combination with brassicas or only using small grains. This adds cost/more loads to spread, but a small grain in seed corn fields are critical to help with pests/erosion in my opinion.
- It was suggested to allow cover crops including small grains to be broadcast seeded at detasseling instead of at male destruct to allow more time for establishment and growth once canopy is opened at male destruct. The thought is the small grains can help hold the soil better when it’s wet with equipment. Small grains also help hold the soil from erosion after grazing as not much is left after grazing turnips/radishes. Some are choosing to drill a small grain after harvest.
- Some growers are allowed to plant seed corn green while others aren’t. Growers doing this are plugging drill units where seed is going to be planted. Whether growers terminated early or not, they all shared the small grain roots before seed corn held the soil during winds and held equipment better in wet fields.
- Group of growers in Archer/Central City area are relay cropping wheat/beans in year after seed corn. Something to consider for making small grains work better economically. Several growers doing this allowed for market to develop for taking small grains in that area.
- Much discussion on relay cropping beans using hybrid rye, grain sorghum, rye, wheat for economics. Also discussed the need for bankers to allow a 2-3 year balance sheet to show economics of small grain outside of one year. Will share thoughts mentioned on economics in another column.
If interested, our next topic on February 9th (10-noon at the 4-H Bldg in York) is Strategies for integrating livestock on crop ground both in the off-season and during the growing season.


JenREES 1-20-19
Stress. We all have it in life. I didn’t really think about how stress can be good until my colleague Brandy VanDeWalle asked us some questions during her presentation at the Cow-Calf College. She asked us what we look like with good stress. Thinking about it, good stress allows me to be that much more productive in achieving tasks. I’m not a procrastinator, but long gone are the days where I used to color code my planner. My experiences with the military and being in Extension allowed me to give all that up for being spontaneous and flexible with the changes and deadlines placed upon me each day. So that’s me and good stress. We were also asked what we look like with bad stress. Many of us shared we tend to withdraw from others and be shorter/abrupt in responses than we intend. Weather perhaps plays a huge role in adding stress to lives for those of us in agriculture.
Research has shown each person has around 70,000 thoughts per day with 80% of the more repetitive thoughts being negative. Wow-80% negative! That blew me away. But they don’t have to be. Research also showed that taking a 10 minute walk reduced cortisol (stress hormone) in the brain by 50-70%. Even if a person doesn’t walk, taking a break can help. Last week we lost a couple of Nebraska farmers and my heart goes out to their families. The National Farm Medicine Center in Wisconsin tracked farm suicides during the 1980’s in the Upper Midwest and found that the suicide rates were 58 for every 100,000 farmers and ranchers. Suicide rates today are more than 50 percent higher than they were in the 1980’s at the peak of the farm crisis.
It’s so hard to know what others are going through; so often we wear masks. I’ve done this too. We’re all prone to much pride in life, especially in the midst of struggling. I challenge us all to do more in 2019. Let’s pay more attention to those around us, spend more time connecting, be more honest about our situations. There’s so many times a simple text, phone call, email, or visit changed the outlook on my day. Last week a farmer shared how the weather made for a challenging time with calving; a neighbor stopped by and brought him a slice of breakfast pizza. That simple act of noticing his struggle and taking time to talk changed his outlook. So let’s check in with each other more and have the courage to be honest about how things are truly going. There’s also a number of free resources for help including: Nebraska Farm Hotline – 1-800-464-0258; Farm Mediation Clinics 1-800-464-0258; Nebraska Legal Aid: http://www.legalaidofnebraska.com.
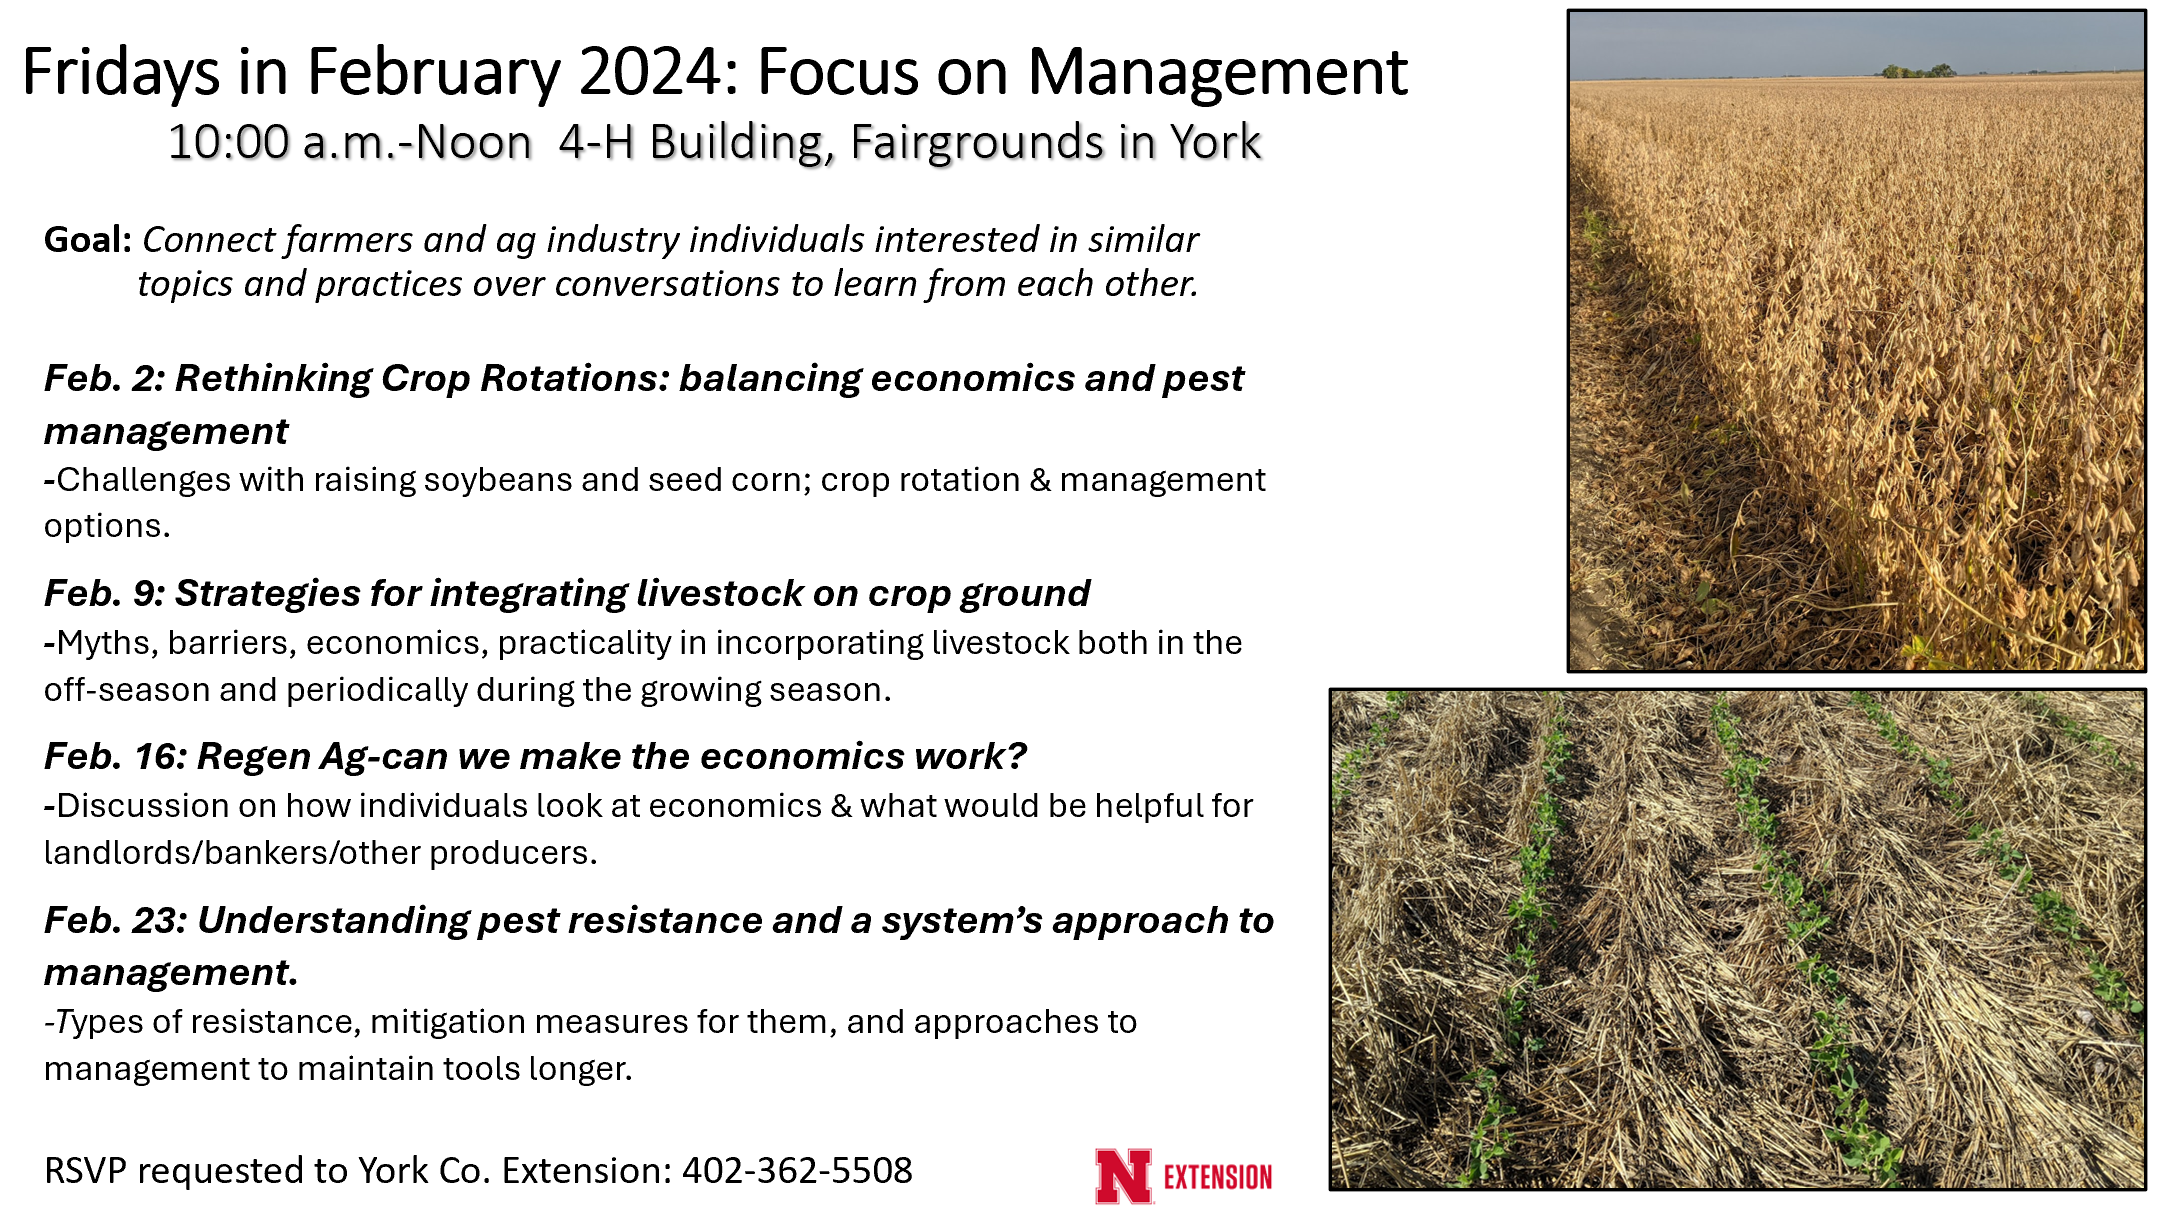
Economics: In thinking through options for lowering input costs, there’s several things that come to mind. Some may even be good on-farm research projects to test. One consideration with the new farm bill is the fact that there will be an increase in CRP acres. So, producers have a decision to make regarding potentially enrolling acres into CRP. And, if doing that, perhaps converting some land next to that area into an annual forage system is another option if you have cattle. I will go into the details of this in another column. We have had some guys doing this and it’s just another alternative to consider.
Reducing soybean populations without affecting yields has been proven via on-farm research for 12 years now. I’ve documented this regardless of what has happened in-season. We even had a York county producer who did this study in 2018 and raised 93 bu/ac with a final average stand of 67,000 plants/ac! And, for those with dectes stem borer, my observation has been that dectes doesn’t penetrate the stems as easily on these thicker stems in lower population fields. I don’t have any research, though, so if you’re interested in testing that, please let me know.
Common thinking is that max yield provides max returns. There’s some things like early soybean planting that I will always push for increasing yields. But otherwise, I tend to look at that statement differently and ask if we always have to look at max yields. What if we looked at maximizing economics instead? I realize a lot of seed purchases have been made. There’s some strong flex hybrids that yield really well in non-irrigated environments. A couple of farmers have also mentioned this to me. We’re curious what would happen if we put them under irrigation at lower populations. It could even be an on-farm study to compare a low pop (28K or less), lower input system to one’s current system with higher inputs. However, the question would be which is most economical in the end. Please let me know if you’d be interested in trying this.
I’ve also had a handful of guys mentioning they were interested in sorghum because of the reduced input costs. For those of you who I worked with during the last farm bill who kept sorghum base acres, I mentioned it may be wise to plant sorghum somewhere on those farms before the next farm bill because we never know what will happen regarding payments. We’ve learned in this new farm bill that there will be a payment reduction for any crop not grown in the last 10 years that you have base acres for. So that may be another reason to consider planting some sorghum for the future. If it’s been awhile since you’ve planted sorghum, there’s a free sorghum symposium on January 24 in Grand Island at the Extension Office. Registration begins at 9 a.m. and you can RSVP at: 402-471-4276.
Long-Term Irrigation Water Requirements for Corn in the Little Blue Natural Resources District Counties
Irmak S-Newsletter Article LBNRD-Final (PDF version of this article)
Authored by:
Suat Irmak
University of Nebraska–Lincoln
239 L. W. Chase Hall, P.O. Box 830726, Lincoln, NE 68583-0726
E-mail: sirmak2@unl.edu Ph: (402) 472-4865
http://engineering.unl.edu/bse/faculty/suat-irmak-0/|
(Author’s note) The scientific and research-based data and their interpretation presented in this article is intended solely for informational purposes and should not be interpreted otherwise in any shape or form. As a University faculty member, the author cannot and will not take sides with respect to water resources allocation decisions. Thus, the author is not for or against any potential water allocation. The author sees his role as an unbiased university faculty member is to share information and data with all people we serve to aid in making better-informed decisions. The following information was presented to the Little Blue Natural Resources District Board by the author on December 6, 2016.
Water allocations may occur in areas where long- or short-term rate of depletion of water resources exceeds water availability. Availability (decline or increase) of water resources can be impacted by numerous natural and human factors, including:
- Overpumping of surface and/or groundwater resources due to suboptimal irrigation management that result in over-irrigation [optimal irrigation management is considered as using one of the or a combination of the technologies available (soil-based, climate-based, or plant-based) to determine the proper irrigation timing and amount to meet crop water requirements for optimum crop growth and yield],
- Change in climatic variables, including air temperature, precipitation, solar radiation, wind speed, vapor pressure deficit,
- Soil physical properties,
- Potential changes in crop water use as a result of changes in climatic and other hydrologic variables,
- Changes in growing season length,
- Cropping patterns, including changes in crop hybrids, varieties, and cultivars, and switching from agricultural lands to natural land use (e.g., grasslands) and vice versa,
- Irrigation methods used as well as irrigation management practiced,
- Soil and crop management practices,
- Geologic conditions, including elevation,
- Other factors.
Thus, when water allocation programs are planned, the aforementioned factors should be taken into account to develop and implement a reasonable, but effective, allocation program. Discussions have been occurring in the Little Blue Natural Resources District (LBNRD) in terms of potential water allocations. In this article, long-term (30 years) data are presented to evaluate the impact(s) of various water allocation amounts in terms of meeting (or not meeting) crop water requirements for one of the major agronomic row crops produced in the district (corn). The counties considered in the analyses are: Adams, Clay, Jefferson, Thayer, Webster, Nuckolls, and Fillmore. Dr. Irmak has been conducting numerous scientific research projects in this part of the state for corn, soybean, sorghum, winter wheat, sweet corn, seed corn, and other cropping systems since 2003. Some of the major research topics include, but are not limited to: soil-water resources and irrigation engineering; crop water use efficiency; variable rate irrigation and fertigation; agricultural water management and conservation; measurement and modeling of surface energy balance, evapotranspiration, transpiration, evaporation and water productivity of agro-ecosystems; spatio-temporal plant water extraction; agro-meteorology; impact of change in climate variables on water resources and agro-ecosystem productivity; impact of tillage practices on water and energy balance; cover crop impact on soil quality and water and energy balance; measurement and modeling of soil moisture dynamics and soil physical properties.
Using long-term climate and crop water production functions that have been measured in Dr. Irmak’s research fields, crop water requirements were calculated for each growing season from 1986 to 2015 for corn. Detailed procedures are presented in refereed scientific journal articles published by Dr. Irmak and his research team and all these scientific publications are available.
Precipitation Trends
One of the critical variables that impact water availability and water balance components in any given area is precipitation. The growing season total precipitation amounts from 1986 to 2015 for seven counties are presented in Figure 1. While it varies with various factors, the growing season in this article was assumed to be from planting in May 1 to physiological maturity in September 30. The growing season precipitation has a fluctuating trend, but overall, there are declining trends in all counties. The magnitude of decline in precipitation exhibited substantial variation between the counties. The growing season precipitation has declined by 5.58, 6.41, 1.21, 2.68, 4.51, 4.45, and 1.73 inches in Adams, Clay, Jefferson, Thayer, Webster, Nuckolls, and Fillmore County, respectively, from 1986 to 2015. When the average of all counties is considered, the LBNRD has been receiving 3.79 inches of less precipitation in recent years than it did in mid-1980s and early 1990s, which can considerably impact water availability in the area and these changes in precipitation trends as well as magnitudes can substantially impact water balance analyses. It should be noted that the aforementioned magnitudes of trends are calculated from 1986 to 2015 and if a different period was used, the magnitudes and trends may change. However, the important point in Figure 1 is the significant overall decline in precipitation over time.
Gross Irrigation Requirements for Corn
Gross irrigation requirement (GIR) is defined as the amount of water required to be pumped to meet the net crop water requirement in the field. Not all pumped water can make it to the crop root zone due to losses during the water transport and application process. Since some amount of water is lost during this process due to conveyance, distribution, field application, evaporation, canopy interception, leaks, etc. additional amount of water is needed to be pumped to ensure adequate net irrigation requirement in the crop root zone is met. The net irrigation requirement (NIR) is the amount of water that is actually needed in the crop root zone to meet crops’ evaporative demand (evapotranspiration) to maintain adequate growth and development for optimum yield production. The amount of water that needs to be pumped to achieve net irrigation requirement is a function of the efficiency of the irrigation system used and other factors. By definition, the NIR does not include losses that may occur during the transport, distribution, and application of water in the field as opposed to gross irrigation water requirement. Thus, the NIR needs to be adjusted with the irrigation system’s efficiency. It should be noted each irrigation system has a different irrigation efficiency value and this value is not constant, rather it is dynamic and change over time, even in the same growing season as a function of numerous factors, including climatic factors and canopy development. For example, not all center pivots have the same or similar irrigation efficiency value and the values can change significantly depending on numerous factors, including how any given system is managed (in addition to climatic conditions and canopy development). Thus, using accurate irrigation system efficiency value is important for accurate quantification of GIR.
Annual gross irrigation requirements (GIR) of corn for all counties for each year are presented in Figure 2. As expected, GIR varied substantially from year to year as a function of numerous factors that influence crop water use, primarily climatic variables, including precipitation. These GIR values were determined for a healthy center pivot-irrigated corn crop that is actively growing and transpiring water vapor and result in very good grain yield (e.g., 230-250 bu/ac). The GIR values were adjusted by the irrigation efficiency of the center pivot, which is assumed to be 85%. It should be noted that the irrigation efficiency of a center pivot system is not a constant value, and can significantly change with numerous factors, including pivot operation conditions, maintenance, crop growth stage, crop management, and other factors. Thus, even for the same center pivot system, the efficiency value can change over time within the same growing season. Even a well maintained center pivot can have very low irrigation efficiency, depending on the conditions in which the irrigation application is practiced. This is valid for all other irrigation systems, but with different irrigation efficiency values.
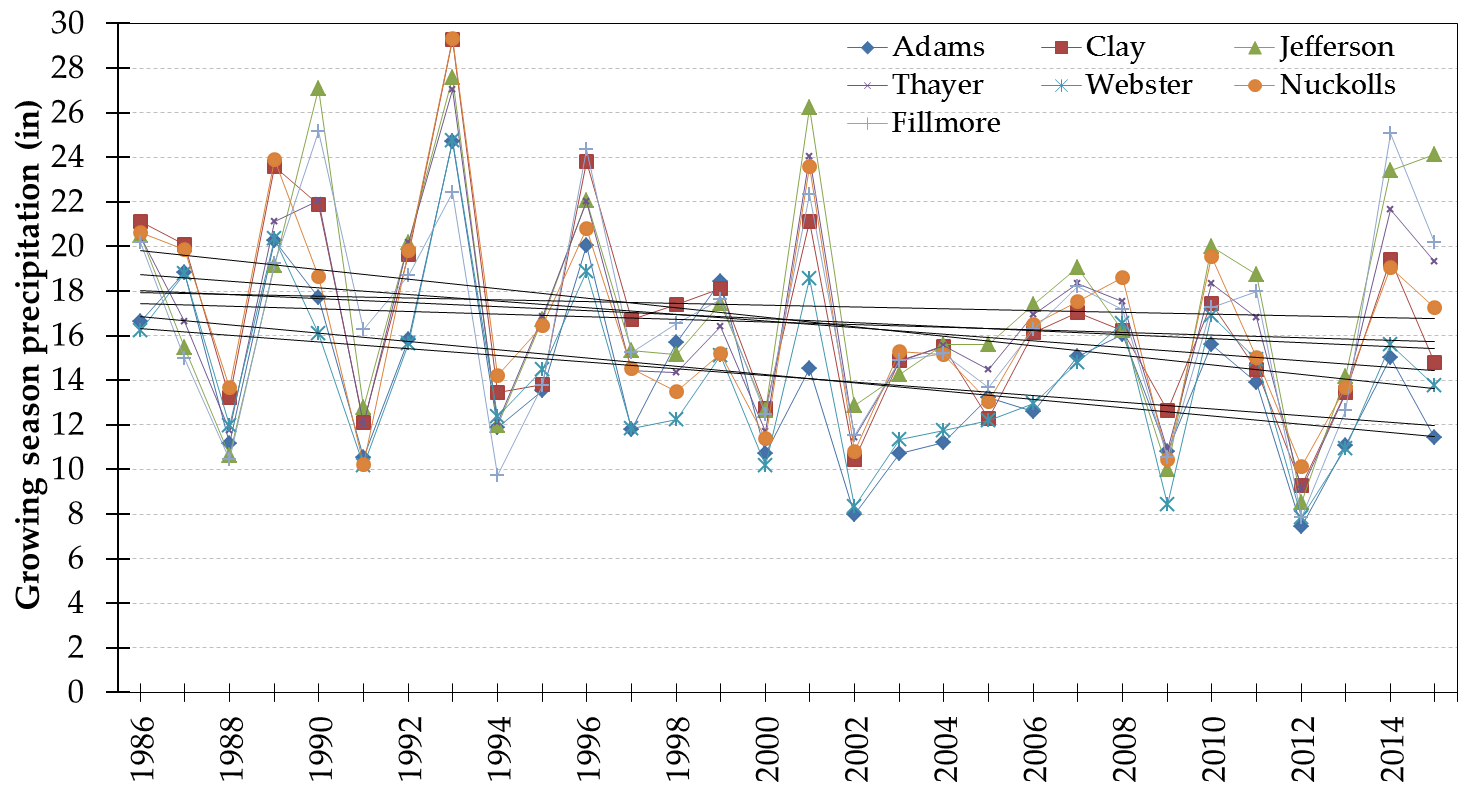
Figure 1. Temporal (1986-2015) distribution of growing season precipitation in seven counties in the LBNRD.
The GIR for corn ranged from zero in all counties in 1993 (which was one of the wettest years in Nebraska) to as high as 26.9 inch in 2002 in Webster County (Figure 2e). The GIR values were also very high for all counties in 2012 (about 26 inches). Figure 2 is an example of inter-annual variation in irrigation requirements in that it is different every year. Thus, using an average value for GIR or water allocation programs may not provide a detailed picture of this variation.
For much more effective determinations of adequate GIR for a given county, the standard deviations of the GIR values should be considered. Standard deviation values represent the amount of difference from the mean (average) value. The standard deviation values of long-term average corn GIR for each county is presented in Figure 3. As Figure 3 clearly shows, the long-term average GIR values have very large standard deviations that should be taken into account. The standard deviation of long-term average corn GIR ranged from 5.9 inches in Adams County to as high as 7 inches in Jefferson County with a seven county average value of 6.6 inches. The interpretation of the standard deviation values should also be done very carefully, because it will considerably impact the crop productivity response to an average allocation amount. For example, in Jefferson County, in a given year, the long-term average corn GIR can be as much as 7 inches above the long-term average GIR value, depending on the climatic and other conditions. If this happens in a given year, the crop production and associated farm net income would be significantly jeopardized when the water allocation is determined based on the long-term average value. While it is used in practice very often, when natural systems are considered, there is no such term as “normal” as every year is different when various climatic variables are considered. However, determining the standard deviations and especially determining the allocation amounts based on the standard deviations for multiple counties that have spatial attributes is an extremely difficult task. Therefore, in many applications, long-term values are used instead, perhaps for simplification.
Different Water Allocation Amounts and Meeting the Corn Irrigation Requirements
Different hypothetical amount of water allocation amounts and what percent of the time these amounts are not able to meet corn crop’s GIR in each county are presented in Table 1. In Table 1, the allocation amounts were varied from 7 to 12 inches and the number of years and the percentage (with respect to total number of years from 1986 to 2015, which is 30) when the allocation amount was not able to meet corn GIR were determined. The interpretation of Table is rather very simple. For example, a 7-inch of water allocation was below corn GIR in 17, 17, 14, 17, 22, 21, and 12 years out of 30 years in Adams, Clay, Jefferson, Thayer, Webster, Nuckolls, and Fillmore Counties, respectively. In terms of percentage, a 7-inch water allocation was not enough to meet corn GIR at 56.7, 56.7, 46.7, 56.7, 73.3, 70, and 40% of the time in Adams, Clay, Jefferson, Thayer, Webster, Nuckolls, and Fillmore Counties, respectively. The impact of other allocation amounts (8, 9, 10, 11, and 12 inches) on meeting (or not meeting) corn GIR can be interpreted in the same way in Table 1.
Table 1. Percent of time when different water allocation amounts would not meet corn gross irrigation requirement (GIR).

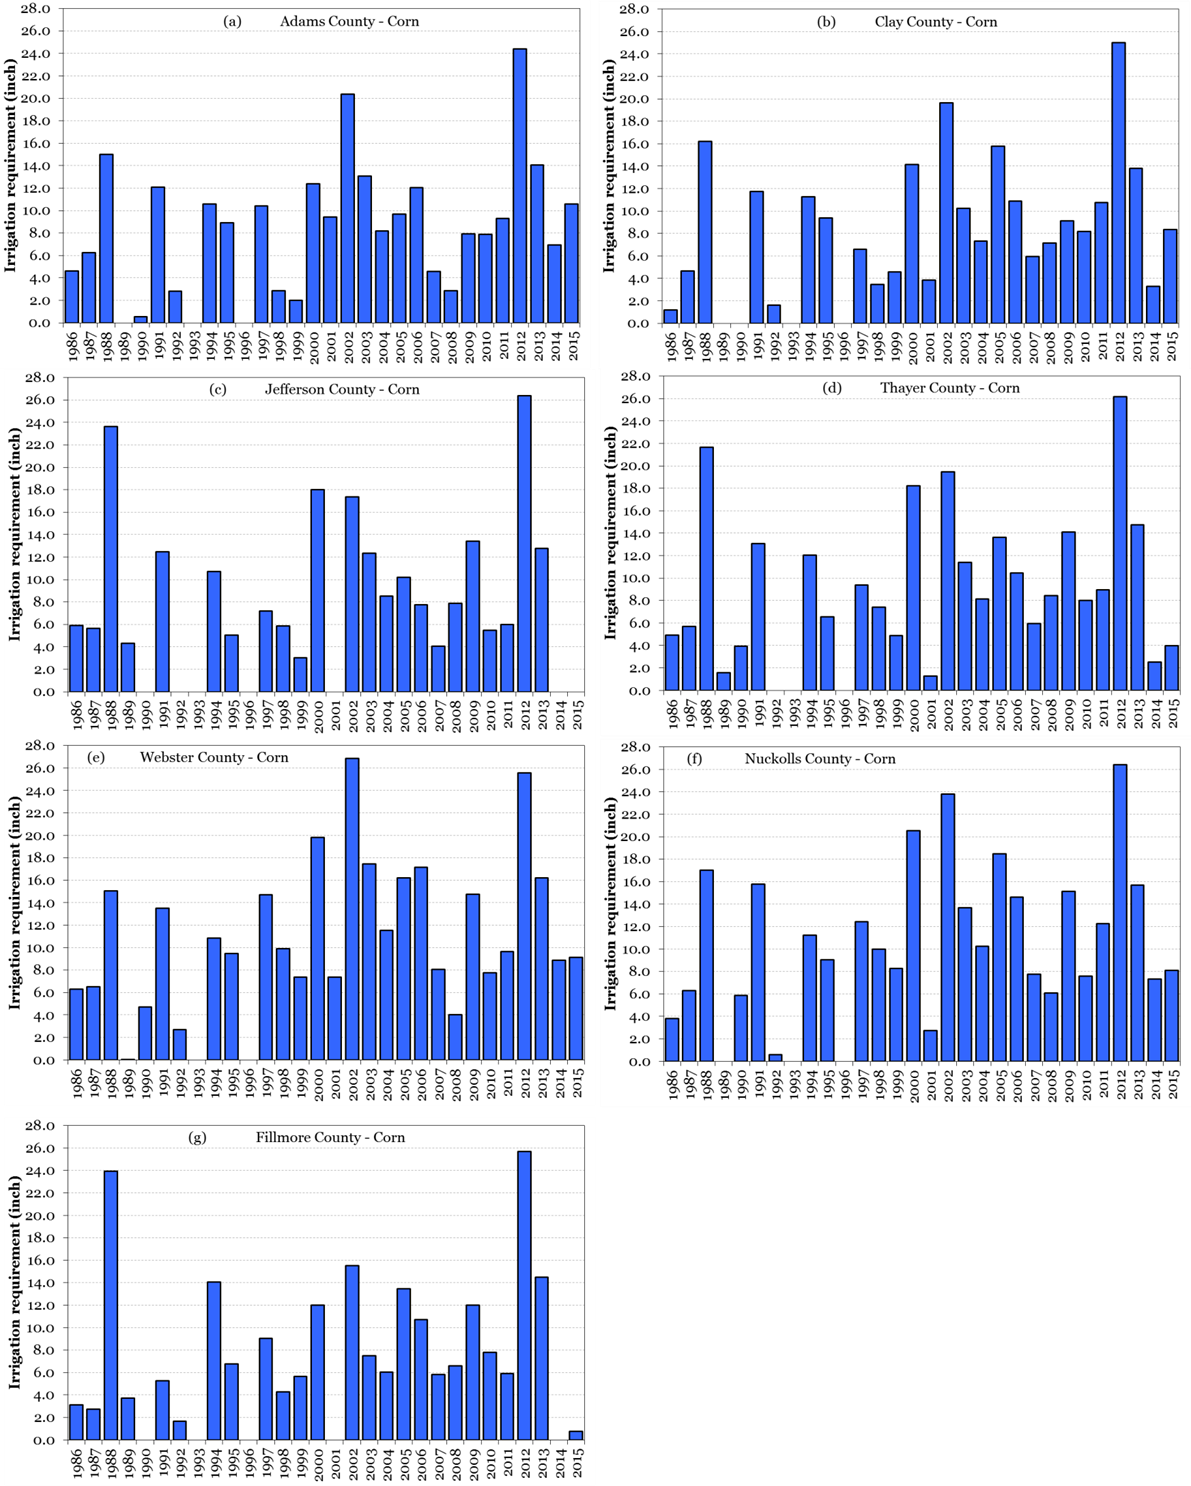
Figure 2. Temporal distribution of corn gross irrigation requirements (GIR) in seven counties in the LBNRD from 1986 to 2015.

Figure 3. Standard deviation (inch) of gross irrigation requirement (GIR) for corn in seven LBNRD counties. The standard deviation values were calculated for the period from 1986 to 2015.
It is important to note that the analyses for potential impact(s) of various hypothetical water allocation amounts on meeting (or not meeting) corn irrigation water requirement to produce good yields (e.g., 230-250 bu/ac) were carried out for the period from 1986 to 2015 for specific counties in the LBNRD. Analyses, data, and interpretations should not be extrapolated beyond these boundaries.
Information and data provided above are solely for information and education purposes. The author does not take any sides or provide any opinion as to whether allocation should be imposed or not. If the decision is made to go forward with the allocation, some of the most effective water allocation programs are those that incorporate research-based educational and outreach aspects of water management and university can offer technical and scientific aid to growers and others who are involved in crop production and irrigation practices to make the best use of the allocated amount of water resources for optimum crop production. This includes implementation of technology to counter some of the potential negative impact(s) of limited water resources for optimum crop production. There are numerous proven, effective irrigation management strategies, tools, and methods developed at UNL that result in enhanced crop water productivity. This can be achieved by reducing or eliminating over-irrigation and conserving water resources through reducing unnecessary water withdrawal for irrigation. For some of these resources, readers are encouraged to visit the Nebraska Agricultural Water Management Network (NAWMN) website at http://water.unl.edu/cropswater/nawmn. Some of the publications that are related to irrigation science and engineering, evapotranspiration of various cropping systems in each of the NE counties, water management technologies, climate impact(s) on agricultural productivity, and related topics are also listed in Dr. Irmak’s website at https://engineering.unl.edu/bse/faculty/suat-irmak-0/.
Sensitive Issues Training-Engage
Many of us have been there…we’ve been asked a question in which the answer can be deemed controversial because the topic is based on emotion and beliefs. How do we respond? Do we get caught up in the emotion and passion of the issue and try to force our beliefs on others? Do we shy away or try to avoid an answer altogether by remaining silent?
Last week’s Sensitive Issues Media and Communications Training was developed to help all of us through these situations. It was a remarkable experience working with an amazing group of ladies, all passionate about food, but looking at food from a variety of perspectives and taking an issues-based approach in developing our team. Our team was comprised of a livestock expert, a manure expert, two food and nutrition experts, a communication’s expert, and myself from a crop production perspective. Special thanks to Dr. Chuck Hibberd, Nebraska Extension Dean and Director, for providing us a New Audiences Innovation Grant to partially fund this training. You can catch the conversation on Twitter at #SIMCT15.
We invited the Center for Food Integrity to conduct their Engage training with us, which was sponsored by the United Soybean Board. This training uses “the power of shared values to highlight industry trends and teaches strategies for using values-based messaging in daily conversations, and public speaking and media opportunities.” There was discussion, role playing, and mock media interviews. The training challenged me to use something I also just learned from “7 Habits of Highly Effective People” training….Seek first to Understand, then to be Understood.
Essentially, ask questions. Understand why a consumer believes X, Y, or Z about food and agriculture. Universal values include:
- Compassion
- Responsibility
- Respect
- Fairness
- Truth
Seek to understand the other person’s values by listening and asking questions. Then share by communicating about common values telling your food and ag story. We can’t really script this. We can’t be so vague that we’re not credible. For example, the following is vague and perhaps over-used:
By doing X we help the environment.
Instead, we need to be willing to talk about the hard issues with authentic transparency…to share our own individual stories.
I also desire water that is safe for my family to drink and desire for there to be enough water for future generations. That’s why my colleagues and I work with farmers to use research-based irrigation scheduling tools. Doing so helps reduce over-irrigation which can reduce the nitrate levels reaching our groundwater and the amount of water being pumped from the aquifer.
There were a few surprises for me. The first being the progress in one year (based on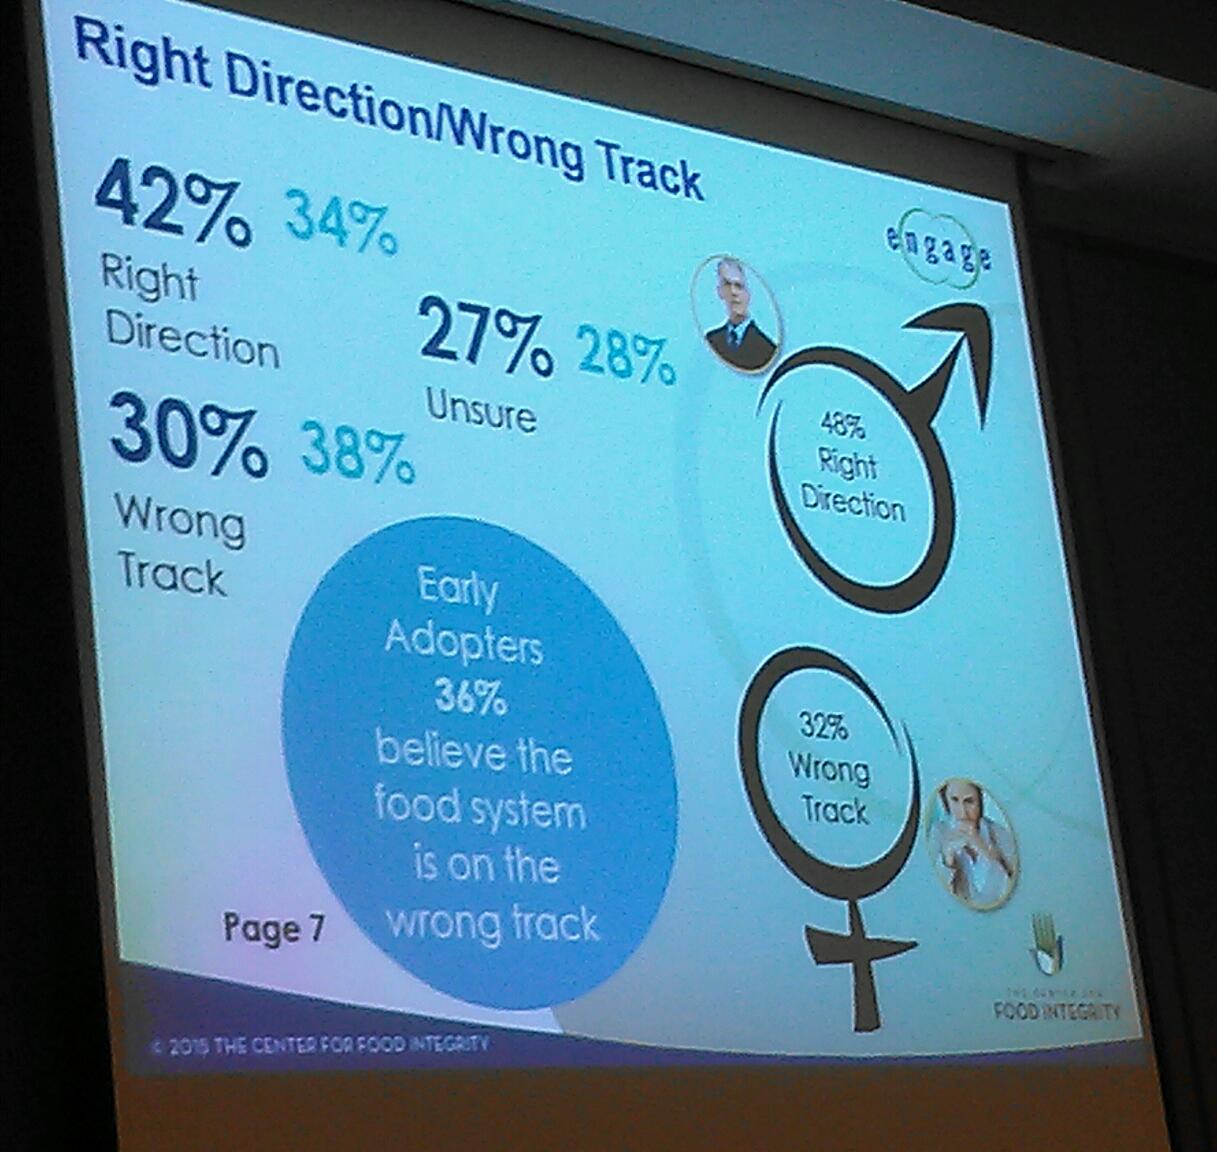 the Center for Food Integrity’s research) that we’ve made in consumer trust. This slide is essentially saying that 42% of consumers feel the food system is going the right direction (up from 34% last year). Men are more trusting of the food system at 48% believing the food system is on the right track. 32% of women feel the food system is on the wrong track.
Another surprising, yet encouraging piece of information for  me to see is which people are trusted the most on sensitive topics. On the topic of genetically modified foods, University Scientists topped the list, a Scientist that was a Mom was second, and Farmers were third. This is different than other research I’d seen, so I was excited about this. It was a survey of 2005 individuals conducted in 2014 and was encouraging from the standpoint that we do still have an opportunity to share our stories with those who truly desire to know more about where their food comes from. We will never change the activists, but we can reach the middle.
Finally, I loved the following quote which is so true:
A picture is worth 1000 words; a video is a library.
They showed the following video from Similac entitled, “The Mother ‘Hood“. Instantly, my mind went to how easy it would be for ag to do something similar. We tend to be so divided, but division is killing us. We are in the business of providing a safe, affordable, food supply to the world…but beyond that, our diversity provides consumer choice. If you watch the video, consider what is the common issue that could bring all of ag together. I have some ideas and my team members and I have discussed what a similar video with diverse agriculture groups would look like. What are your thoughts and ideas?
Nebraska’s Advantage
This week, I’d like to share some information that came out in a white paper from the UNL  Agricultural Economics Department on the special relationship we have here in Nebraska between crops, livestock, and biofuel production capacity not found in other parts of the U.S. to the extent we have here. It’s called the “Nebraska Advantage”.
I think it’s important for all of ag industry to realize we need each other as it seems we sometimes forget how inter-dependent we are. Crop producers need the livestock and ethanol industries as they are a high percentage of our end users. Yet many times I hear of crop producers fighting livestock expansion or livestock coming into an area. The purpose of the white paper was to share the numbers of where Nebraska livestock, grain production, and ethanol production currently stands, and what Nebraska could gain if we worked to increase livestock production in-state where we have a wealth of resources with our crops, water, and biofuel production.
Nebraska currently ranks 1st in irrigated acres, 1st in commercial red meat production and is tied with Texas for cattle on feed, 2nd in corn-based ethanol production, 3rd in corn for grain production, 4th in soybean productions, 6th in all hogs and pigs, and 7th in commercial hog slaughter, and 9th in table egg layers. However, in reading this white paper, one quickly realizes we’re not taking advantage of the tremendous grain production capacity here in the State.
We export over 1/3 of our annual corn crop, at least half of the in-state production of distiller’s grains (a co-product from ethanol production that is fed to livestock), and more than 80% of our soybean meal output. Corn and soybean production have increased in our State by 50 and 25% respectively, which is a blessing due to our irrigation capacity. But increasing amounts of this grain are being shipped out-state instead of benefiting rural economies in Nebraska if it was used in-state for value-added livestock production and processing instead.
In the white paper, graphs are shown comparing Nebraska to neighboring states. These graphs show Nebraska lagging neighboring states in growth of the livestock industry. For example, while Nebraska overall increased in hog production, the inventory increased 17.2% during the first half of the decade, but declined 11.8% in the second half. In comparison, Iowa realized an increase of 31.5% within the decade. What was really interesting to me is the fact that Nebraska exports 2.5 million pigs annually to neighboring states to be finished and shipped back to Nebraska for processing, showing potential for growth in the market hog sector. The dairy sector has also declined in herd numbers in Nebraska compared to other states and Nebraska’s poultry industry (mostly egg laying hens) has declined over the past decade in spite of constant numbers across the U.S.
When one looks at Nebraska’s economy, cash receipts from all farm commodities totaled over $25.6 billion in 2012 and livestock/livestock product sales was 45% of this total ($11.6 billion). Increased employment, local tax revenue, value-added activity, and manure for fertilizer are all economic benefits of livestock expansion. The paper stated,
A base expansion scenario that includes a 25% increase in market hogs, a doubling of dairy cow numbers, a ten percent increase in fed cattle production and a tripling of egg production, along with the associated processing industries, has the potential to provide an additional 19,040 jobs, with labor income of almost $800 million and value-added activity of over $1.4 billion. This activity has the potential to generate over $38 million in local tax revenue. While this amounts to a fairly small percentage of Nebraska’s total economy, these impacts will occur almost entirely in non-metropolitan areas of the state and would be quite beneficial to rural economies.
Livestock development has been held back by various issues and policies including: limitations on corporate farming activity in Nebraska, state and local permitting processes, nuisance roles and lawsuits, and issues/concerns from the general public and interest groups. The final conclusion of the paper was that significant growth in employment and economic output throughout Nebraska is dependent upon these issues being overcome.
I would challenge all of us to keep an open mind when producers desire to diversify by including livestock in their operations or through livestock expansion. In many cases, doing so allows another person to come back to an operation, or allows someone to get started farming, which in the long run benefits our rural economies. It’s ok to ask questions, to become more educated. It’s through these questions that one learns how production practices have changed to ensure the health and welfare of our livestock and in odor reduction from the facility and manure application. You can read the entire white paper contents here.
Connecting with Extension to Enhance the Land Grant Mission
My thoughts on the importance of connecting with Teaching and Research to ensure Extension’s and the Land Grant Institution’s future success, relevancy, and existence.
I had the opportunity to provide a seminar to the UNL Agronomy and Horticulture  Department last week which was truly an honor. As I thought about what to present, I kept thinking about the future of Extension and two major challenges I see Extension facing in the next 100 years…actually now.
Challenge of losing our research base.
Challenge of sharing our unbiased, research-based information in the places where customers are receiving information.
I continue to think about Extension’s Mission: We provide unbiased, research-based information to the people to ultimately improve their lives.
My thoughts kept centering around the fact that in order for me to achieve Extension’s Mission, I need to be more connected with the people on campus and research stations. I need to know about their research to share with our customers. For us to be the best Land Grant University System we can be in…
View original post 336 more words
Keeping Your Farm in the Family for the Next Generation
I would encourage any farmers, spouses, and adult children to consider attending this Farmers and Ranchers Program! Communication and fair transition plans are keys to keeping family ties and the family farm strong. I’ve watched too often where communication doesn’t occur-even most recently with my extended family-and the heartache caused as a result. Work on the communication and transition plan now before it’s too late!
The final Farmers & Ranchers College program for the 2012-13 programming year will be held on March 14, 2013 starting at 6:00 p.m. with a meal and the program to follow. It will be held at Evening with Friends Restaurant in Milligan and will feature Dr. Ron Hanson, Neal E. Harlan Professor of Agribusiness, Ag Economics Dept., UNL. A description of Hanson’s program is provided below.![]()
The entire process for mapping out a succession plan to transfer the eventual ownership of a family farm from one generation (parents) to the next generation (their adult children) can be an overwhelming task for many families. Where does this process even begin? Who makes the final decisions? Can you be fair to everyone involved? What if there is not good communications within the family? How do you keep emotions and personal jealousies from taking over and preventing good decision making? These…
View original post 348 more words

