Long-Term Irrigation Water Requirements for Corn in the Little Blue Natural Resources District Counties
Irmak S-Newsletter Article LBNRD-Final (PDF version of this article)
Authored by:
Suat Irmak
University of Nebraska–Lincoln
239 L. W. Chase Hall, P.O. Box 830726, Lincoln, NE 68583-0726
E-mail: sirmak2@unl.edu Ph: (402) 472-4865
http://engineering.unl.edu/bse/faculty/suat-irmak-0/|
(Author’s note) The scientific and research-based data and their interpretation presented in this article is intended solely for informational purposes and should not be interpreted otherwise in any shape or form. As a University faculty member, the author cannot and will not take sides with respect to water resources allocation decisions. Thus, the author is not for or against any potential water allocation. The author sees his role as an unbiased university faculty member is to share information and data with all people we serve to aid in making better-informed decisions. The following information was presented to the Little Blue Natural Resources District Board by the author on December 6, 2016.
Water allocations may occur in areas where long- or short-term rate of depletion of water resources exceeds water availability. Availability (decline or increase) of water resources can be impacted by numerous natural and human factors, including:
- Overpumping of surface and/or groundwater resources due to suboptimal irrigation management that result in over-irrigation [optimal irrigation management is considered as using one of the or a combination of the technologies available (soil-based, climate-based, or plant-based) to determine the proper irrigation timing and amount to meet crop water requirements for optimum crop growth and yield],
- Change in climatic variables, including air temperature, precipitation, solar radiation, wind speed, vapor pressure deficit,
- Soil physical properties,
- Potential changes in crop water use as a result of changes in climatic and other hydrologic variables,
- Changes in growing season length,
- Cropping patterns, including changes in crop hybrids, varieties, and cultivars, and switching from agricultural lands to natural land use (e.g., grasslands) and vice versa,
- Irrigation methods used as well as irrigation management practiced,
- Soil and crop management practices,
- Geologic conditions, including elevation,
- Other factors.
Thus, when water allocation programs are planned, the aforementioned factors should be taken into account to develop and implement a reasonable, but effective, allocation program. Discussions have been occurring in the Little Blue Natural Resources District (LBNRD) in terms of potential water allocations. In this article, long-term (30 years) data are presented to evaluate the impact(s) of various water allocation amounts in terms of meeting (or not meeting) crop water requirements for one of the major agronomic row crops produced in the district (corn). The counties considered in the analyses are: Adams, Clay, Jefferson, Thayer, Webster, Nuckolls, and Fillmore. Dr. Irmak has been conducting numerous scientific research projects in this part of the state for corn, soybean, sorghum, winter wheat, sweet corn, seed corn, and other cropping systems since 2003. Some of the major research topics include, but are not limited to: soil-water resources and irrigation engineering; crop water use efficiency; variable rate irrigation and fertigation; agricultural water management and conservation; measurement and modeling of surface energy balance, evapotranspiration, transpiration, evaporation and water productivity of agro-ecosystems; spatio-temporal plant water extraction; agro-meteorology; impact of change in climate variables on water resources and agro-ecosystem productivity; impact of tillage practices on water and energy balance; cover crop impact on soil quality and water and energy balance; measurement and modeling of soil moisture dynamics and soil physical properties.
Using long-term climate and crop water production functions that have been measured in Dr. Irmak’s research fields, crop water requirements were calculated for each growing season from 1986 to 2015 for corn. Detailed procedures are presented in refereed scientific journal articles published by Dr. Irmak and his research team and all these scientific publications are available.
Precipitation Trends
One of the critical variables that impact water availability and water balance components in any given area is precipitation. The growing season total precipitation amounts from 1986 to 2015 for seven counties are presented in Figure 1. While it varies with various factors, the growing season in this article was assumed to be from planting in May 1 to physiological maturity in September 30. The growing season precipitation has a fluctuating trend, but overall, there are declining trends in all counties. The magnitude of decline in precipitation exhibited substantial variation between the counties. The growing season precipitation has declined by 5.58, 6.41, 1.21, 2.68, 4.51, 4.45, and 1.73 inches in Adams, Clay, Jefferson, Thayer, Webster, Nuckolls, and Fillmore County, respectively, from 1986 to 2015. When the average of all counties is considered, the LBNRD has been receiving 3.79 inches of less precipitation in recent years than it did in mid-1980s and early 1990s, which can considerably impact water availability in the area and these changes in precipitation trends as well as magnitudes can substantially impact water balance analyses. It should be noted that the aforementioned magnitudes of trends are calculated from 1986 to 2015 and if a different period was used, the magnitudes and trends may change. However, the important point in Figure 1 is the significant overall decline in precipitation over time.
Gross Irrigation Requirements for Corn
Gross irrigation requirement (GIR) is defined as the amount of water required to be pumped to meet the net crop water requirement in the field. Not all pumped water can make it to the crop root zone due to losses during the water transport and application process. Since some amount of water is lost during this process due to conveyance, distribution, field application, evaporation, canopy interception, leaks, etc. additional amount of water is needed to be pumped to ensure adequate net irrigation requirement in the crop root zone is met. The net irrigation requirement (NIR) is the amount of water that is actually needed in the crop root zone to meet crops’ evaporative demand (evapotranspiration) to maintain adequate growth and development for optimum yield production. The amount of water that needs to be pumped to achieve net irrigation requirement is a function of the efficiency of the irrigation system used and other factors. By definition, the NIR does not include losses that may occur during the transport, distribution, and application of water in the field as opposed to gross irrigation water requirement. Thus, the NIR needs to be adjusted with the irrigation system’s efficiency. It should be noted each irrigation system has a different irrigation efficiency value and this value is not constant, rather it is dynamic and change over time, even in the same growing season as a function of numerous factors, including climatic factors and canopy development. For example, not all center pivots have the same or similar irrigation efficiency value and the values can change significantly depending on numerous factors, including how any given system is managed (in addition to climatic conditions and canopy development). Thus, using accurate irrigation system efficiency value is important for accurate quantification of GIR.
Annual gross irrigation requirements (GIR) of corn for all counties for each year are presented in Figure 2. As expected, GIR varied substantially from year to year as a function of numerous factors that influence crop water use, primarily climatic variables, including precipitation. These GIR values were determined for a healthy center pivot-irrigated corn crop that is actively growing and transpiring water vapor and result in very good grain yield (e.g., 230-250 bu/ac). The GIR values were adjusted by the irrigation efficiency of the center pivot, which is assumed to be 85%. It should be noted that the irrigation efficiency of a center pivot system is not a constant value, and can significantly change with numerous factors, including pivot operation conditions, maintenance, crop growth stage, crop management, and other factors. Thus, even for the same center pivot system, the efficiency value can change over time within the same growing season. Even a well maintained center pivot can have very low irrigation efficiency, depending on the conditions in which the irrigation application is practiced. This is valid for all other irrigation systems, but with different irrigation efficiency values.

Figure 1. Temporal (1986-2015) distribution of growing season precipitation in seven counties in the LBNRD.
The GIR for corn ranged from zero in all counties in 1993 (which was one of the wettest years in Nebraska) to as high as 26.9 inch in 2002 in Webster County (Figure 2e). The GIR values were also very high for all counties in 2012 (about 26 inches). Figure 2 is an example of inter-annual variation in irrigation requirements in that it is different every year. Thus, using an average value for GIR or water allocation programs may not provide a detailed picture of this variation.
For much more effective determinations of adequate GIR for a given county, the standard deviations of the GIR values should be considered. Standard deviation values represent the amount of difference from the mean (average) value. The standard deviation values of long-term average corn GIR for each county is presented in Figure 3. As Figure 3 clearly shows, the long-term average GIR values have very large standard deviations that should be taken into account. The standard deviation of long-term average corn GIR ranged from 5.9 inches in Adams County to as high as 7 inches in Jefferson County with a seven county average value of 6.6 inches. The interpretation of the standard deviation values should also be done very carefully, because it will considerably impact the crop productivity response to an average allocation amount. For example, in Jefferson County, in a given year, the long-term average corn GIR can be as much as 7 inches above the long-term average GIR value, depending on the climatic and other conditions. If this happens in a given year, the crop production and associated farm net income would be significantly jeopardized when the water allocation is determined based on the long-term average value. While it is used in practice very often, when natural systems are considered, there is no such term as “normal” as every year is different when various climatic variables are considered. However, determining the standard deviations and especially determining the allocation amounts based on the standard deviations for multiple counties that have spatial attributes is an extremely difficult task. Therefore, in many applications, long-term values are used instead, perhaps for simplification.
Different Water Allocation Amounts and Meeting the Corn Irrigation Requirements
Different hypothetical amount of water allocation amounts and what percent of the time these amounts are not able to meet corn crop’s GIR in each county are presented in Table 1. In Table 1, the allocation amounts were varied from 7 to 12 inches and the number of years and the percentage (with respect to total number of years from 1986 to 2015, which is 30) when the allocation amount was not able to meet corn GIR were determined. The interpretation of Table is rather very simple. For example, a 7-inch of water allocation was below corn GIR in 17, 17, 14, 17, 22, 21, and 12 years out of 30 years in Adams, Clay, Jefferson, Thayer, Webster, Nuckolls, and Fillmore Counties, respectively. In terms of percentage, a 7-inch water allocation was not enough to meet corn GIR at 56.7, 56.7, 46.7, 56.7, 73.3, 70, and 40% of the time in Adams, Clay, Jefferson, Thayer, Webster, Nuckolls, and Fillmore Counties, respectively. The impact of other allocation amounts (8, 9, 10, 11, and 12 inches) on meeting (or not meeting) corn GIR can be interpreted in the same way in Table 1.
Table 1. Percent of time when different water allocation amounts would not meet corn gross irrigation requirement (GIR).
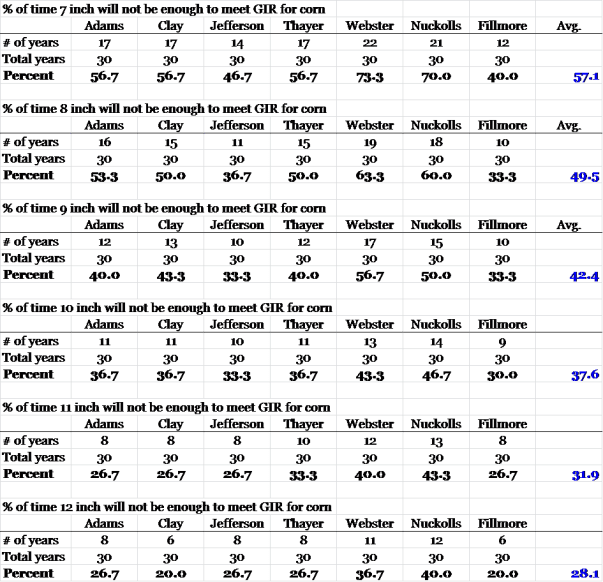
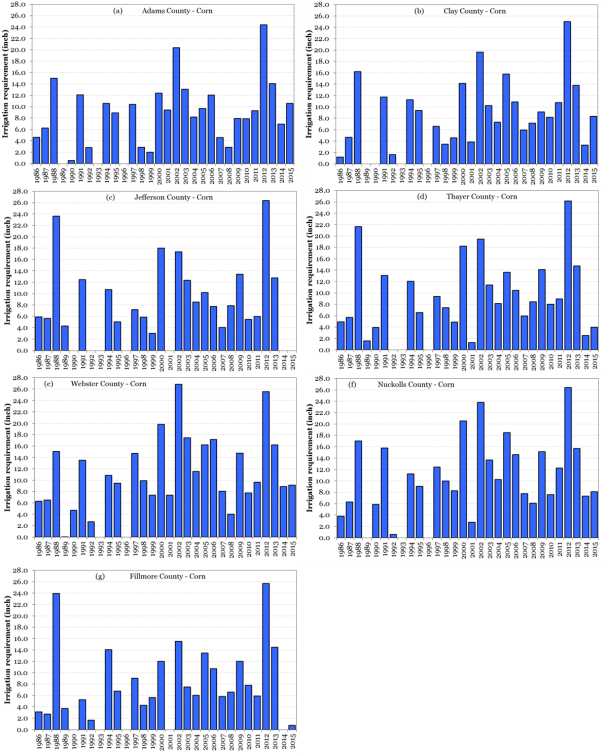
Figure 2. Temporal distribution of corn gross irrigation requirements (GIR) in seven counties in the LBNRD from 1986 to 2015.
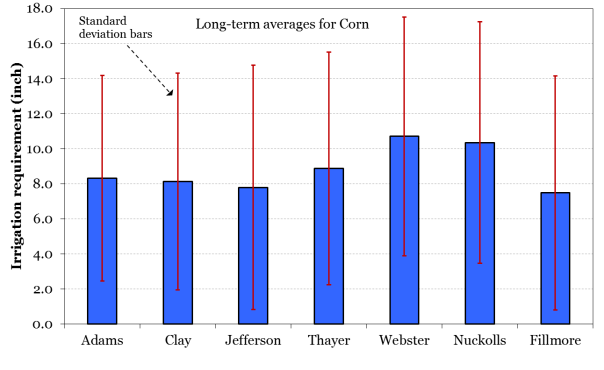
Figure 3. Standard deviation (inch) of gross irrigation requirement (GIR) for corn in seven LBNRD counties. The standard deviation values were calculated for the period from 1986 to 2015.
It is important to note that the analyses for potential impact(s) of various hypothetical water allocation amounts on meeting (or not meeting) corn irrigation water requirement to produce good yields (e.g., 230-250 bu/ac) were carried out for the period from 1986 to 2015 for specific counties in the LBNRD. Analyses, data, and interpretations should not be extrapolated beyond these boundaries.
Information and data provided above are solely for information and education purposes. The author does not take any sides or provide any opinion as to whether allocation should be imposed or not. If the decision is made to go forward with the allocation, some of the most effective water allocation programs are those that incorporate research-based educational and outreach aspects of water management and university can offer technical and scientific aid to growers and others who are involved in crop production and irrigation practices to make the best use of the allocated amount of water resources for optimum crop production. This includes implementation of technology to counter some of the potential negative impact(s) of limited water resources for optimum crop production. There are numerous proven, effective irrigation management strategies, tools, and methods developed at UNL that result in enhanced crop water productivity. This can be achieved by reducing or eliminating over-irrigation and conserving water resources through reducing unnecessary water withdrawal for irrigation. For some of these resources, readers are encouraged to visit the Nebraska Agricultural Water Management Network (NAWMN) website at http://water.unl.edu/cropswater/nawmn. Some of the publications that are related to irrigation science and engineering, evapotranspiration of various cropping systems in each of the NE counties, water management technologies, climate impact(s) on agricultural productivity, and related topics are also listed in Dr. Irmak’s website at https://engineering.unl.edu/bse/faculty/suat-irmak-0/.
Posted on January 4, 2018, in Ag Issues, Discussion Topics, Irrigation Scheduling. Bookmark the permalink. Leave a comment.


Leave a comment
Comments 0