Category Archives: Soil Moisture
Soil Moisture 8-17-18
Grateful for good rains for portions of the area last week!
This area received 2.29″ of rain this past week. Corn is near 1/2 milk and really looks good for the drought stress due to a more drought-tolerant hybrid being planted.

Recent rainfall records: 1″ on July 30th; 0.25″ on August 6th; 1.10″ on August 7; 1.5″ on August 14 and 0.10″ on August 15. Corn is near 1/4 to 1/2 milk.
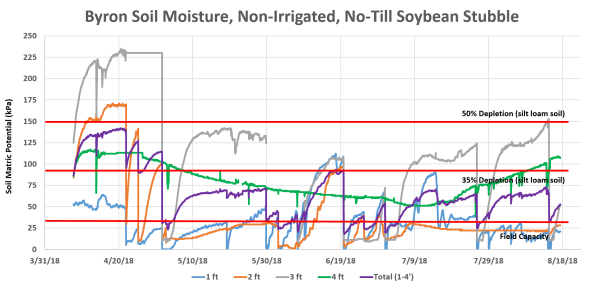
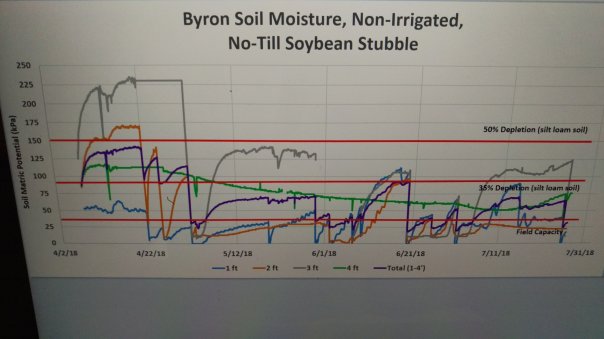
Around 1.0″ was received at this location but the soybean roots took it up faster than it could go into the soil to register on the sensors. Soybeans in this field perked up a little from being wilted down and are using the moisture to fill pods. The cooler weather has also helped slow down drought stress. This is the last week for these sensor readings.
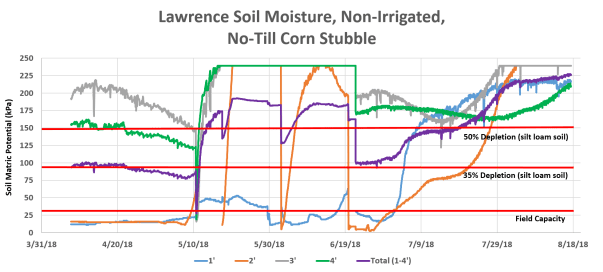
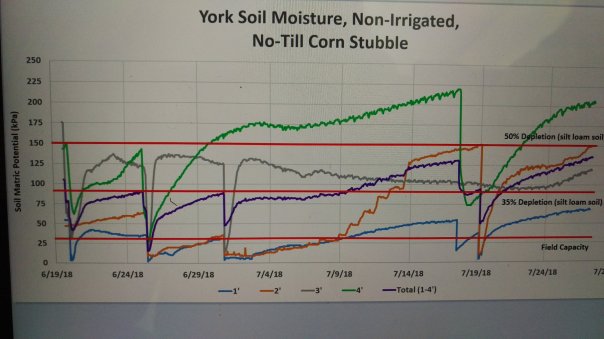
Nearly 1.0″ of rain was received in this field but corn is at black layer and no longer using water. There were several 0.24″ or 0.30″ rain events that created blips on the chart in the first foot the past few weeks but nothing measurable precipitation wise. Corn ears have turned down and harvest will begin in a few weeks. This is the last week for these sensor readings.

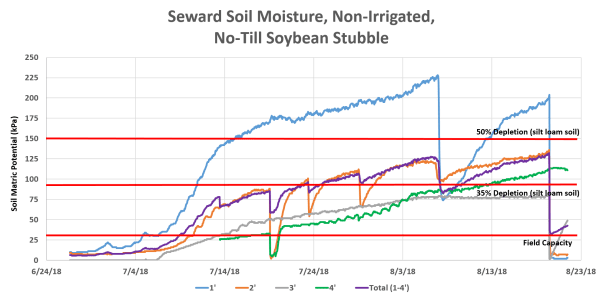
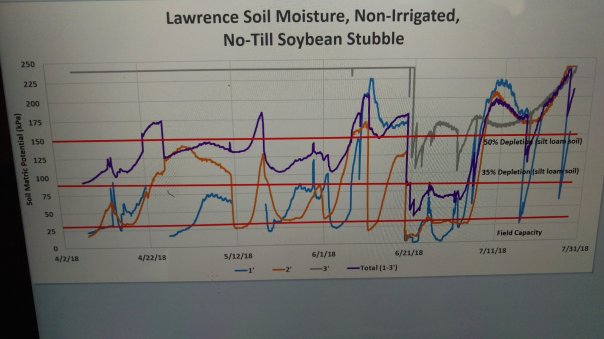
This location received 1.15″ of rain two weeks ago and around 2″ of rain this past week. Corn is in early dent to 1/4 milk stage and using water before it could hit the sensors.
Rainfall totals for this location: 0.49″ on August 13-14; 0.07″ August 16; 1.80″ August 19-20 (the farmer said the total since August 1st been 3.92″ of rain). Corn in this field is 1/3 milk and looks really good.

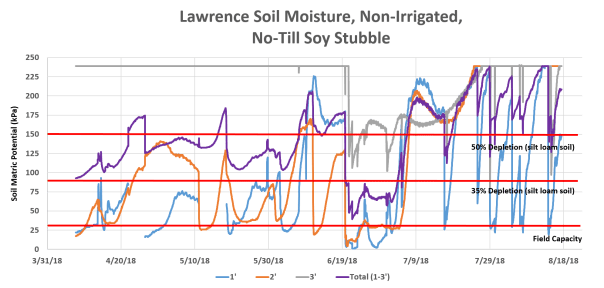
The soybeans on this site have hung on through quite a bit of drought stress. Rainfall totals vary greatly around the York area. This location received around 2.0″ of rain over the past week but the soybean has used it before it’s reached the sensors. Soybean is currently at R6.
Soil Moisture 7-26-18
The drought monitor put a portion of our area back into ‘abnormally dry’. Soil moisture sensors in non-irrigated ground suggest portions of our area should be listed at least in D1 drought status. I got creative in posting these as I had to take pictures with my phone of the pics I created on the computer…so if they’re a little grainy, that’s why. Here’s the updated readings for the area!
On Wed. July 25, this area received 1.7″ one mile south of where the sensors are located and 1.49″ one mile east of it . Corn in this field is at soft dough stage.

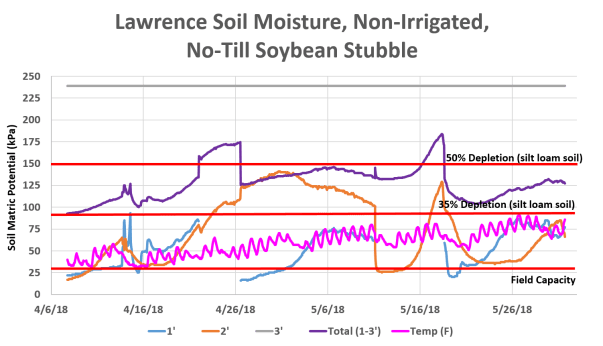
This location only received 0.24″ and is very dry with soil moisture depletion above 50% for all four feet. The soybeans in this field are beginning seed.
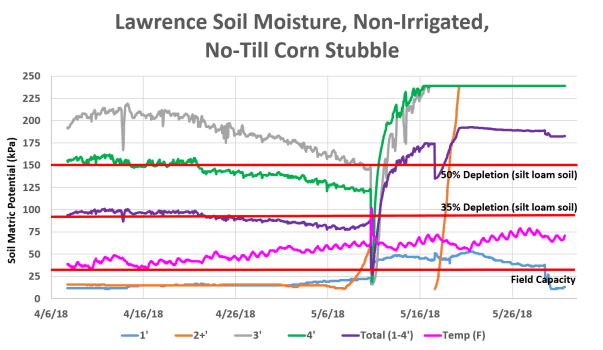
This location also received only 0.24″ of rain. The corn in the field is showing drought stress and soil moisture depletion is above 50% for the profile.

The top foot at this location is steadily drying out with total soil moisture depletion around 35%. Corn is at milk stage.

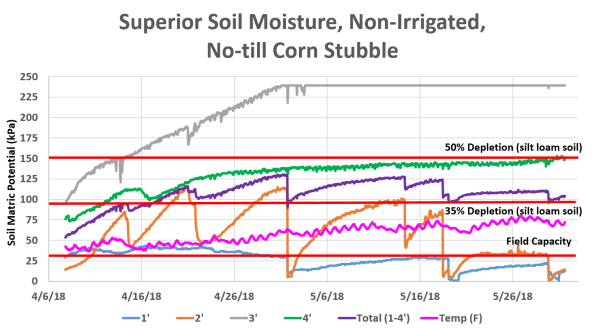
This location received 1.15″ of rain on Wed. July 25. Total soil moisture depletion is above 50% and the field really started showing drought stress the past week.
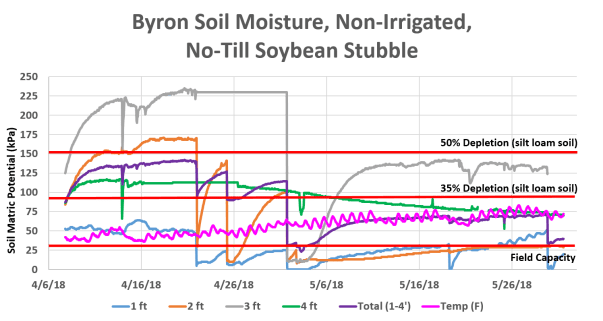
The soybeans in this field are at R5 and total soil moisture depletion is approaching 50% depletion.
Soil Moisture 7-11-18

Drought monitor as of 7-9-18. From the moisture graphs below, I don’t agree that at least portions of Nuckolls and Thayer counties were removed from drought status and other portions of our region no longer show abnormally dry. Even though we were blessed with some large rain events, the moisture really helped only the top two feet of the profile since in areas of this region, the soil moisture status had never fully recharged at the 3 and 4 foot levels. I did not provide graphs last week for groundtruthing as I took a few days off over July 4th. We will see how or if this is adjusted in the future.

This location received 1″ prior to 6/29 since the last graph and ? on July ? Total soil moisture depletion for this location (top 4 feet) is around 30% depletion based on this graph. The third foot is actually hard and dry compared to how wet it showed the past several weeks on these graphs, so I’m unsure if there’s an old root or earthworm channel that’s been keeping the sensor reading wetter than what I actually probe. But it is now drying back out in this graph. Corn at this location is pollinating.
Total rains received since the last graph are ? Total soil moisture depletion (top 4 feet) is at 50%. Corn at this location was three leaves from tasseling on 7/11.
Since the last graph, this location has received ? of rain. Total soil moisture depletion (top four feet) in this field is at 50% depletion. Soybean at this location is nearing beginning pod.
Rains received since the last time I showed graphs are ? Total soil moisture depletion (top three feet) is showing above 50% depletion. Corn at this location is pollinating.

This location has received some rains and current total soil moisture is around field capacity for this field. Corn is pollinating at this location.
This location has been blessed with rains. It wasn’t difficult to install these sensors and the total depletion (currently showing top three feet) around 30% depletion. I hadn’t hooked up the fourth foot sensor yet, thus why no readings are shown this week for it. Corn is pollinating at this location.

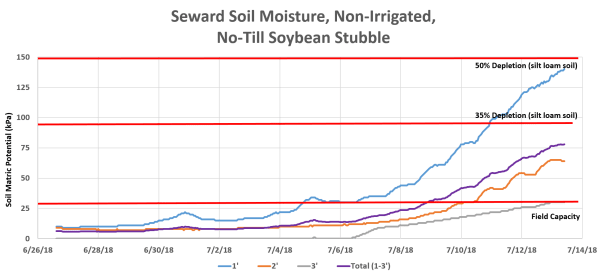
This location received 4.5″ of rain on ? which helped with the top two feet of the profile. An additional ? was received on July 1. Since then, no significant rainfall has been received at this location with the soil moisture depletion (four feet total) around 35%. Soybean is at beginning pod at this location.
Soil Moisture 6-21-18
Grateful to receive rain to help the first and second foot profiles at these locations! Interesting how after 2-3″ of rain on June 20th that the county roads were already dusty and I could drive the dirt lanes in these fields the next day. I will add York, Seward, and Clay soil moisture in my next post.

As of 6/19/18, drought had expanded in Nebraska with 15.4% being abnormally dry (yellow) and 7.4% being in moderate drought (tan). I installed soil moisture sensors in Clay, York, and Seward counties as well for future updates and groundtruthing.
I’m unsure why the third foot keeps rewetting at this location unless there’s old root channels deeper in the profile allowing rain to re-wet around the sensors. Probing this soil, there’s moisture in the top two feet but profile is hard and dry beyond 2.5′. Corn is V10 at this location.
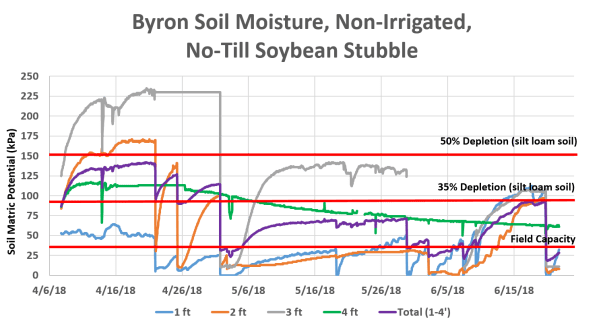
This location received 2.5″ of moisture which was a blessing! Probing the soil, the top 2.25′ of soil re-wet but it was dry and hard below that. Soybeans in this field are at R1.
This location received 2.5″ of moisture which was a blessing! Probing the soil, the top 2.25′ of soil re-wet but it was dry and hard below that. The third foot profile shows up as responding to this rain event but most likely was a quick blip as it can be seen increasing at the end of the chart. Corn in this field is at V7-8.

This site received 0.20″ June 8; 0.70″ on June 17; 3.30″ on June 20 which was a blessing! Probing this location, the top 2.5′ truly re-wetted with the profile hard and dry beyond that. Corn at this location is V8.
Soil Moisture 6/7/18
Nebraska drought monitor map released 6/7/18. 18.1% of State is abnormally dry (yellow) with 5.4% of the State as moderate drought (tan).

Corn is at V7 in this field. The third foot sensor started reading strangely-very wet. The third foot profile is dry but sensor not showing it-thus the total soil moisture is not reflected as dry in this graph as it truly is. This location received 1.33 last week.

I had re-installed the 2 foot sensor in this field and it is showing how dry the second foot has quickly become. The same is seen across the road in the soybean stubble. 0.88″ was received at this location in the past week. Soybeans in this field were at V1 on 6/7/18. This farm family mentioned that first alfalfa cutting was 1/2 of normal this year.
Corn in this field was at V5 on 6/7/18. The soil profile in the top foot is drier compared to in the corn stubble across the road-which has been typical all year. Total soil moisture depletion in this field right now is around 50% for top three feet.

This location was blessed with some rain! 1.35″ was received 6/2/18 and another 0.50″ the morning of 6/7/18. The top two feet truly are muddy in this field when probing the soil but moisture runs out about 2.5 feet down into the profile. Corn was at V5 at this location on 6/7/18.
Soil Moisture 5-31-18
So grateful to receive some rain across the area on May 29th!
This site received 0.78″ on May 29th. The rainfall briefly increased the moisture in the first foot soil profile until high winds the next few days started removing it again.
This site received 0.76″ on May 29 which also added moisture to the first foot briefly. I decided to re-install the 2′ sensor to give a more accurate indication of the soil moisture profile since it is deeper than 2′ in the last two weeks’ charts.
This site also received 0.76″ which very briefly added moisture to the first foot but began drying out again with the winds.
This site received 1.30″ of rain on May 29th which allowed for moisture in both the first and second foot soil profile.
Soil Moisture 5-23-18
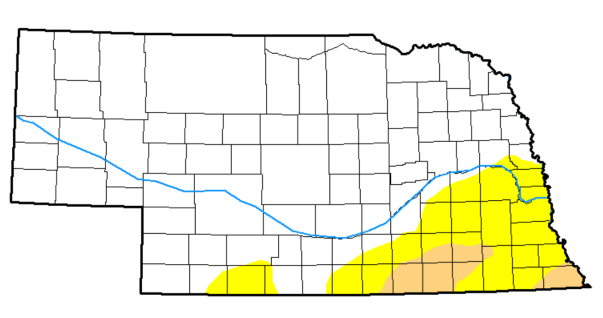
Drought monitor as of 5/22/18: The tan area of moderate drought increased to 3.67% (from 1.88 a week ago) this week while the yellow abnormally dry area decreased to 18.34% (from 22.57% a week ago).
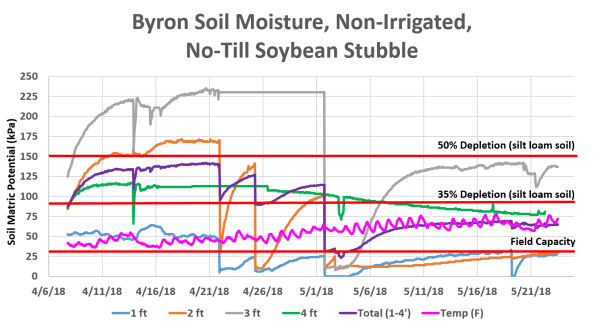
The Byron area received around 0.28″ which allowed for a brief drop in the first foot sensor but didn’t stay there. Both the first and second foot are around field capacity, and there also seemed to be moisture in these feet from probing this field. Total soil moisture depletion is remaining steady.

This site received 0.65-.70 last week and the sensors were re-installed once planting occurred. There were some strange readings in the sensors so I didn’t show the graphs last week. In probing the field, there seemed to be moisture in the top two feet. Thus, I couldn’t understand 2 foot readings shown here. I had reprimed the 2′ sensor last week so I knew it was working. It got installed deeper than 24″ and in probing the soil, it is dry and cumbly below 24″ which seems to be reflected here. Thus why I put 2+’ in the graph for the sensor reading.
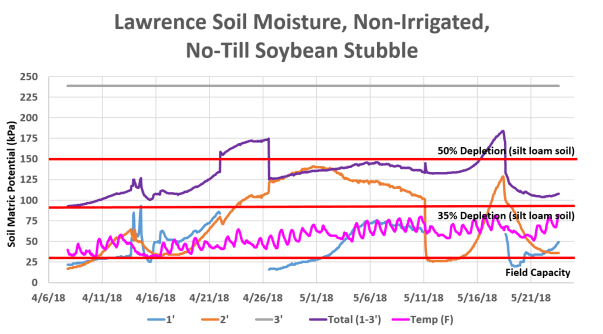
This site, across the road from the corn site, also received 0.65-0.70″ of rain. I also probed this field this week. Total soil moisture depletion is around 40% for this field. The second foot where these sensors are located is in a heavy clay in this field compared to the corn field.
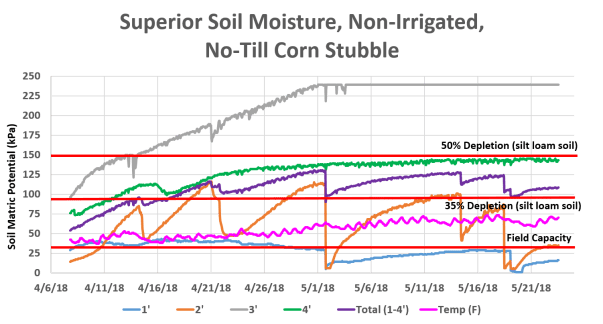
At Superior, a moisture event of 1.05″ was received May 18. This helped add moisture into the top two feet with the second foot around field capacity now. Total soil moisture depletion is around 37%. I also probed this field and there appeared to be moisture in the top two feet and it got dry after that.
Soil Moisture 5-17-18
Hoping these graphs change for us after this past weekend’s rain events! These readings were taken as of 5/17/18.

As of 5/17/18, total soil moisture depletion in this field stayed fairly steady. The top two feet are nearing field capacity.

At the Superior location as of 5/17/18, total soil moisture depletion remained around 40%. The first foot is nearing field capacity with the second foot nearing 35% depletion.
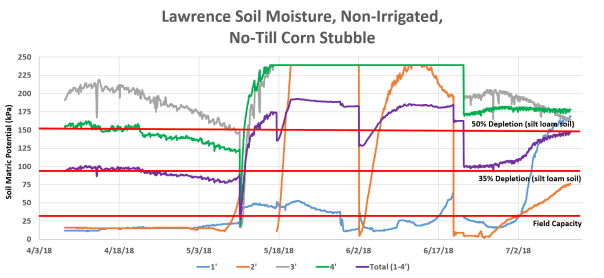
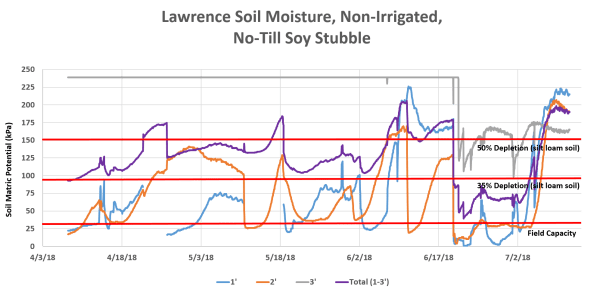
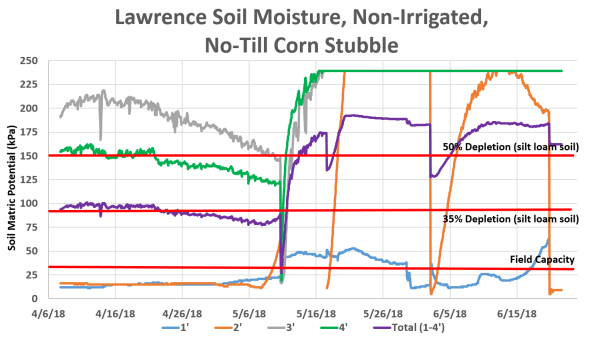
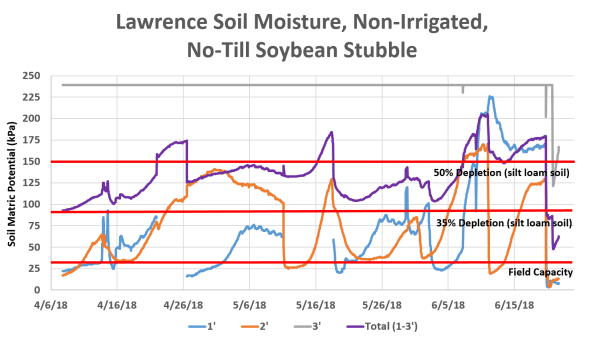
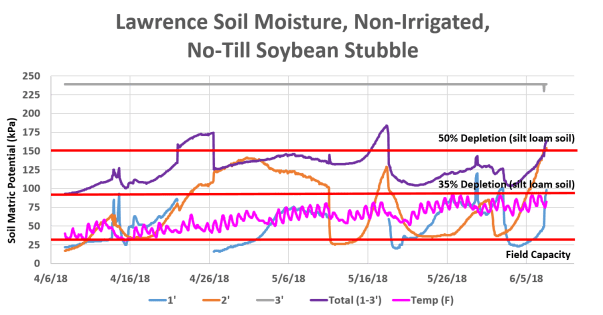
At the Lawrence location I’m just sharing last week’s graphs from 5/10/18. Soybean was planted into the corn stubble on 5/11/18 and the sensors were removed and re-installed with the readings needing time to adjust. The farmer said it was so dry he had to use a drill to re-install the moisture sensors. I have no idea what happened in the soybean stubble field but the readings this past week were crazy so decided to share new graphs on the Lawrence location next week.


Soil Moisture 5-10-18
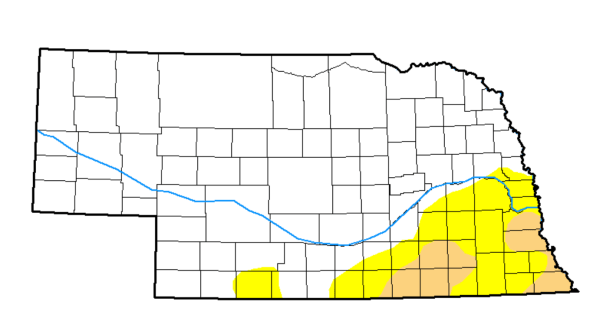
The area of ‘abnormally dry’ or ‘moderate drought’ was reduced by 5% in Nebraska as of 5/8/18 compared to the previous week.
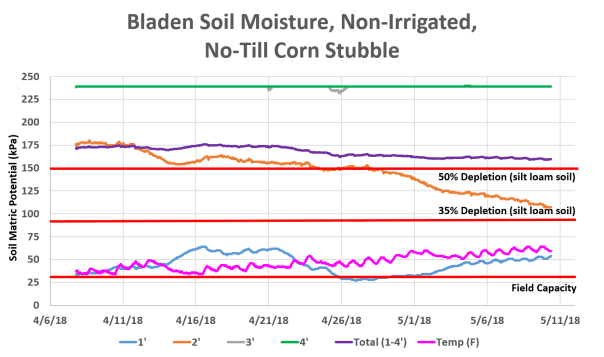
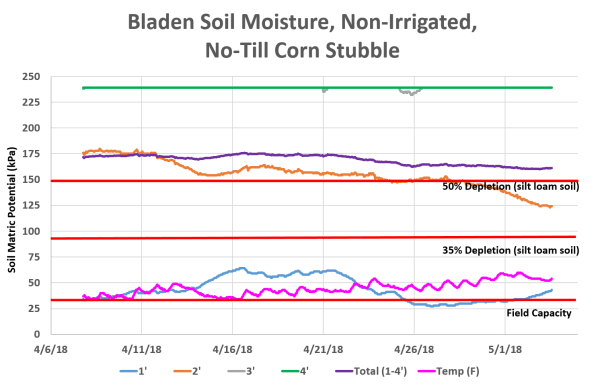
This site has continually missed the rain. The first foot can be observed as slowly drying out as well this week with total soil moisture (1-4′) remaining above 50% depletion. This site was removed due to corn being planted in this field.

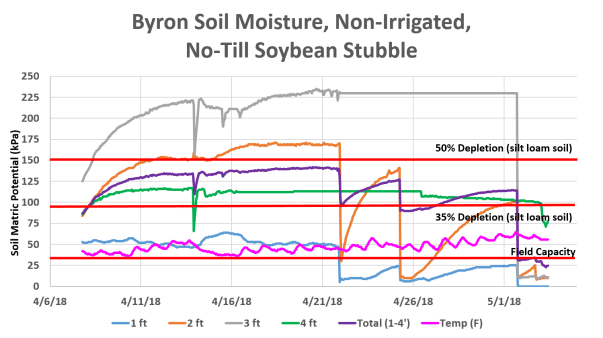
Last week’s rains did help the first and second feet remain below field capacity. However, the third foot did not remain wet after the rainfall event and can be seen climbing in depletion in the graph this week. I did probe this site this week and there appears to be good moisture now just past 2 feet, but it gets dryer after that.
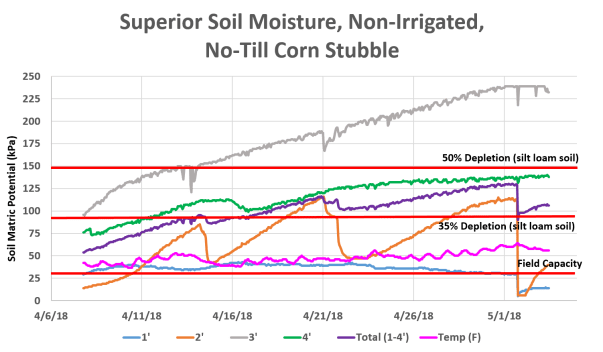
This site continues to remain steady with total soil moisture depletion around 35%.
The first foot sensor has leveled off after being reprimed on 4/26. Total soil moisture depletion (1-3′) remains around 45%.

Last week’s rains helped with the first foot and somewhat with the second foot at this site. Total soil moisture depletion is around 40%.
Soil Moisture 5-3-18
Today was interesting driving my route through the southern tier of counties I serve. Wearing overboots and walking instead of driving to the sensors was welcome at Byron and Superior where heavier rain events occurred this week. However, Lawrence and Bladen had largely missed the rains. The Clay Center location received 1″ the past two days, but other areas of Clay County received very little. The farmers who have allowed me to monitor pre-plant soil moisture thus far were interested in watching this throughout the growing season. Thus, sensors will remain in most of these fields. Where fields have been planted thus far (other than Clay Center), planters have planted around the sensors and seeds have been hand-planted between sensors.

The Nebraska Drought Monitor Map updated 5/1/18 (before the rain events the past few days) showed expanded areas of ‘abnormally dry’ (yellow) and ‘moderate drought’ (tan). Stars show the locations of soil moisture monitoring equipment.
This location essentially missed the rains this week with the top foot remaining around field capacity and 2-4′ near 40% depletion or above. Wheat near this location had jointed but was shorter than at Lawrence and Superior.
This location has been interesting to monitor. Last week I mentioned that moisture received wouldn’t be enough to maintain the second foot near field capacity after 4/26 (which is true from the climb observed in the second foot). This location received 1.5″ the past two days. With the top foot at field capacity, it makes sense that today it is showing near saturation with the second foot dropping below field capacity as well. I should have probed the soil to see if moisture truly reached the third foot or not. The chart shows the third foot also filling below field capacity. We will know more from next week’s graphs. Being a no-till field, the rain soaked in well even though it appeared to come hard from the way the road had washed in spots and was super soft.

This location received some misting as I was collecting this data, but the sun soon came out and steam began rising from this field and the soybean field across the road (next graph). Essentially 0.05″ of rain was received at this location and the graph remained unchanged this week for the most part other than increasing soil temperature.

At this soybean location, something had caused for a disconnection in the 1st foot sensor last week, so I reprimed the sensor on 4/26. I didn’t take out the first 48 hours in this graph (which we say is normal time to acclimate to the soil). The first foot is currently showing over 15% depletion this week with total soil moisture depletion near 50%.
This location received 1.25″ of rainfall the past few days which helped the second foot recharge to near field capacity and the total soil moisture (1-4′) be near 35% depletion. Wheat near this location had jointed and elongated a great deal compared to last week.

