Soil Moisture 5-3-18
Today was interesting driving my route through the southern tier of counties I serve. Wearing overboots and walking instead of driving to the sensors was welcome at Byron and Superior where heavier rain events occurred this week. However, Lawrence and Bladen had largely missed the rains. The Clay Center location received 1″ the past two days, but other areas of Clay County received very little. The farmers who have allowed me to monitor pre-plant soil moisture thus far were interested in watching this throughout the growing season. Thus, sensors will remain in most of these fields. Where fields have been planted thus far (other than Clay Center), planters have planted around the sensors and seeds have been hand-planted between sensors.

The Nebraska Drought Monitor Map updated 5/1/18 (before the rain events the past few days) showed expanded areas of ‘abnormally dry’ (yellow) and ‘moderate drought’ (tan). Stars show the locations of soil moisture monitoring equipment.
This location essentially missed the rains this week with the top foot remaining around field capacity and 2-4′ near 40% depletion or above. Wheat near this location had jointed but was shorter than at Lawrence and Superior.
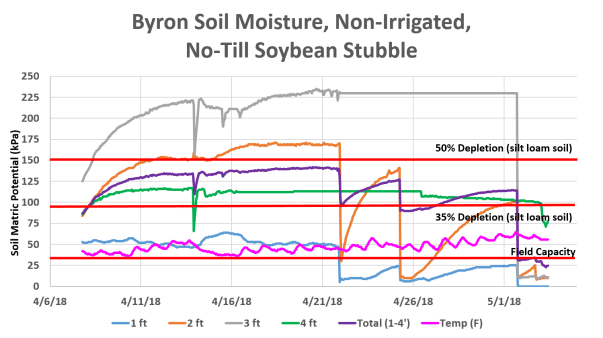
This location has been interesting to monitor. Last week I mentioned that moisture received wouldn’t be enough to maintain the second foot near field capacity after 4/26 (which is true from the climb observed in the second foot). This location received 1.5″ the past two days. With the top foot at field capacity, it makes sense that today it is showing near saturation with the second foot dropping below field capacity as well. I should have probed the soil to see if moisture truly reached the third foot or not. The chart shows the third foot also filling below field capacity. We will know more from next week’s graphs. Being a no-till field, the rain soaked in well even though it appeared to come hard from the way the road had washed in spots and was super soft.

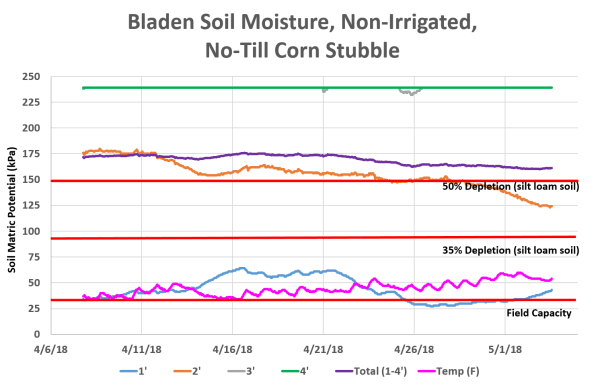
This location received some misting as I was collecting this data, but the sun soon came out and steam began rising from this field and the soybean field across the road (next graph). Essentially 0.05″ of rain was received at this location and the graph remained unchanged this week for the most part other than increasing soil temperature.

At this soybean location, something had caused for a disconnection in the 1st foot sensor last week, so I reprimed the sensor on 4/26. I didn’t take out the first 48 hours in this graph (which we say is normal time to acclimate to the soil). The first foot is currently showing over 15% depletion this week with total soil moisture depletion near 50%.
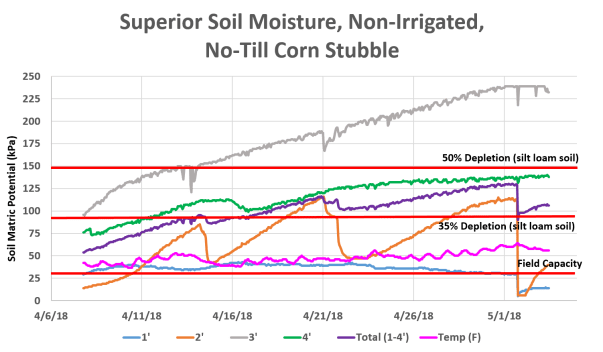
This location received 1.25″ of rainfall the past few days which helped the second foot recharge to near field capacity and the total soil moisture (1-4′) be near 35% depletion. Wheat near this location had jointed and elongated a great deal compared to last week.
Posted on May 4, 2018, in Soil Moisture and tagged beginning soil moisture, drought, Soil Moisture. Bookmark the permalink. Leave a comment.


Leave a comment
Comments 0