Monthly Archives: February 2021
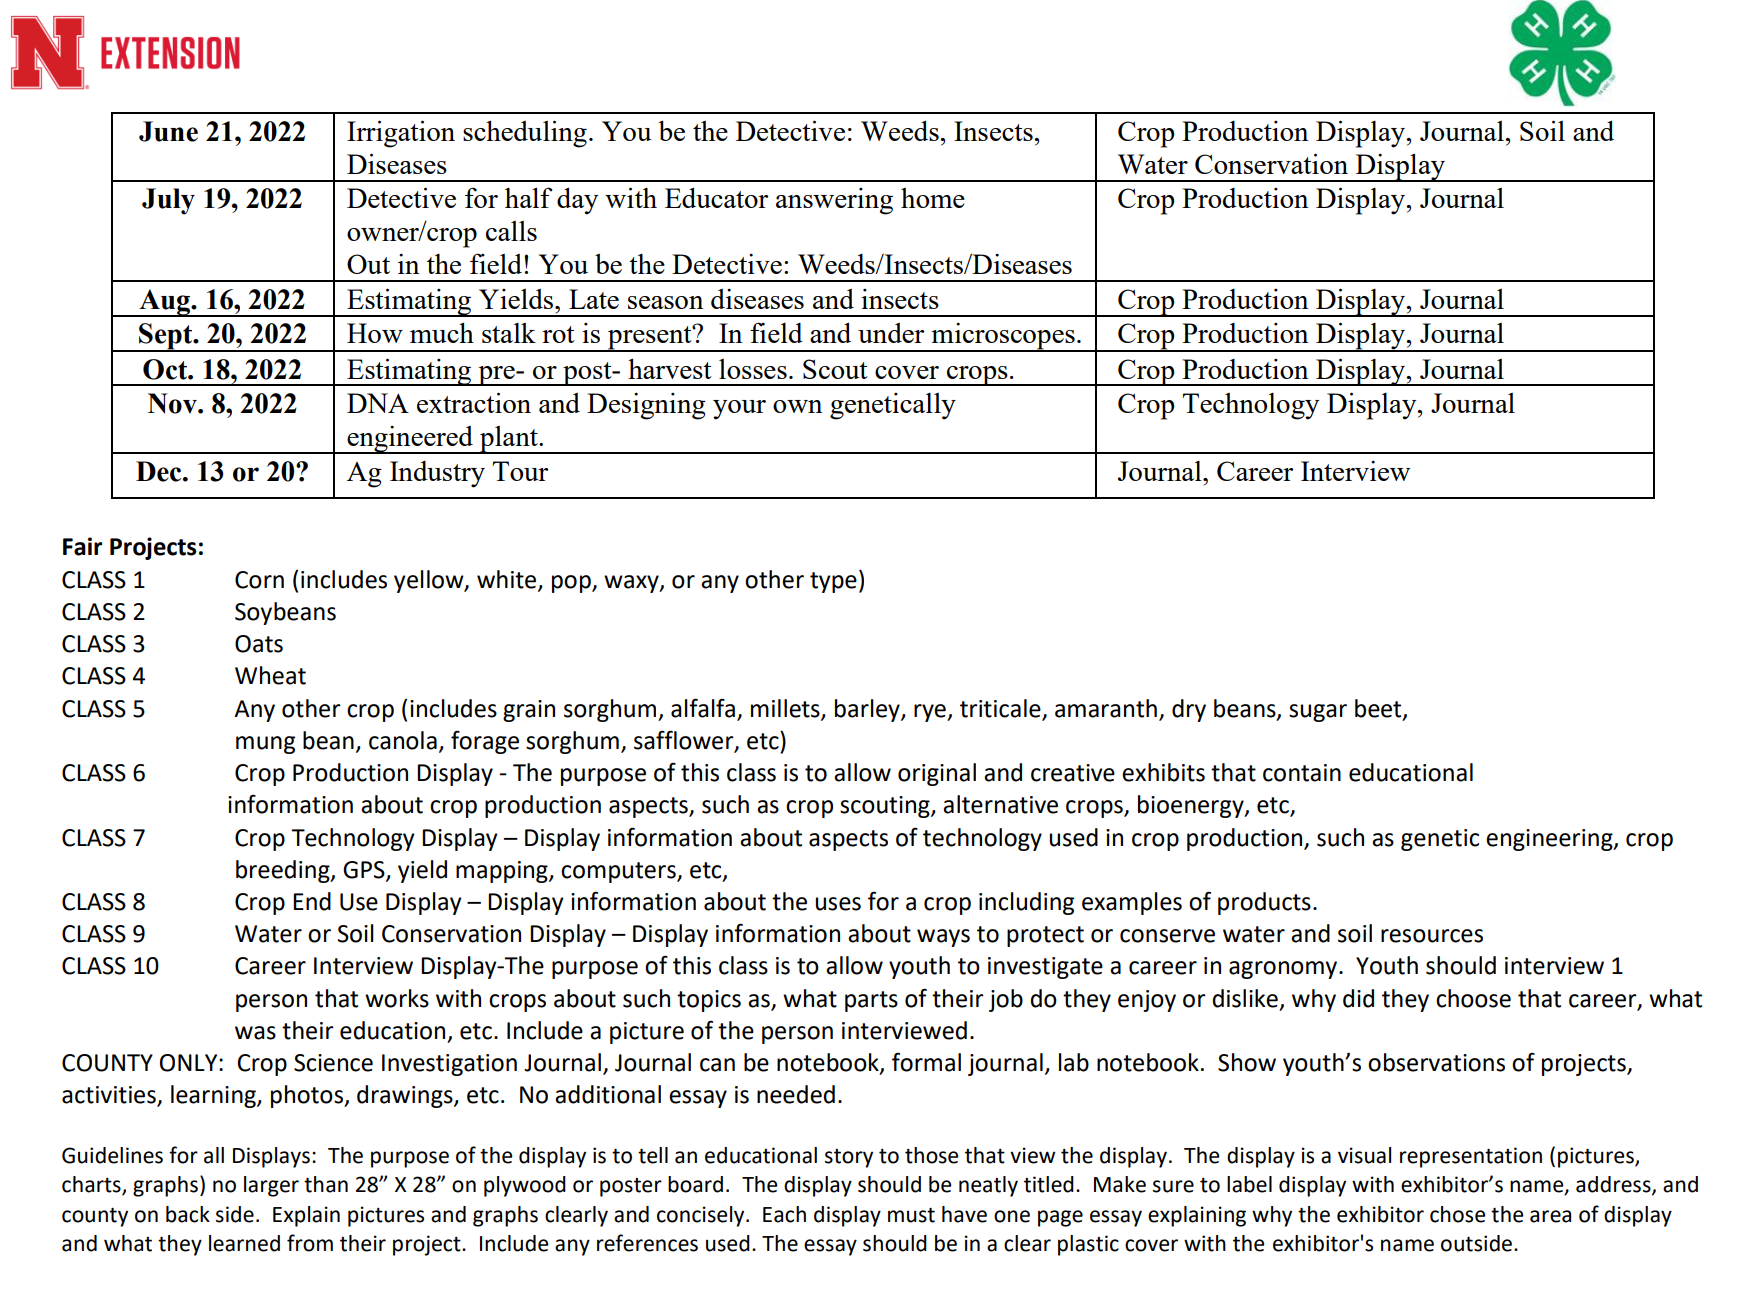
Crop Science Investigation 2021-2022
Are you a youth interested in science, agriculture, plants, crops, insects, or diseases?
If so, you may be interested in joining us for CSI (Crop Science Investigation)!!! You don’t have to be a 4-H member to join and there’s no cost. Each meeting will have different topics for you to become a detective to solve a problem and learn about science, crops, and plants in the process!
Learn about the importance of agriculture and how crops are used!
Conduct cool, hands-on science experiments-like extracting plant DNA!
Become a CSI investigator and detect plant problems!
For questions or to RSVP, please contact: Jenny Rees, York Co. Extension: 402-362-5508, jrees2@unl.edu

JenREES 2-21-21

On-Farm Research Updates: This week brings my favorite winter meetings, the on-farm research updates on Feb. 25 and 26! I’m passionate about on-farm research as it’s such a practical, inexpensive way to address the research questions growers have! These meetings are more meaningful to me because we get to hear from the farmers themselves who conducted the studies and have more discussion around the topics. They do look different this year with a huge number of people registered virtually vs. in-person. They’re also only a half day and we won’t cover the entire book of studies that were conducted. However, whether you participate virtually or in-person, you will hopefully hear from farmers who conducted on-farm research studies. And, this ‘in-person’ meeting does have people at most local sites also presenting in person. I realize that’s been a point of confusion/frustration as we’ve hosted many zoom meetings as ‘in-person’ watch events where no one presented live at the location. Register for virtual or in-person at: https://go.unl.edu/h83j.
I enjoy hearing from the farmers themselves regarding why they conduct on-farm research. The following YouTube video produced in 2020 highlights area farmers David and Doug Cast of Beaver Crossing and Ken Herz of Lawrence: https://youtu.be/tEy-I43CT0E.
Succession/Estate Planning opportunities are upcoming with a two-part webinar event held Feb. 25 and Mar. 4 at Noon. You can register for those at: https://farm.unl.edu/webinars . There’s also an in-person event at Central City at the Fairgrounds on March 2 at 9:30 a.m. and please RSVP to 308-946-3843 if you’d like to attend.
Tree and Houseplant Webinars: A webinar focused on trees will be Feb. 26 from 9 a.m.-Noon with registration here: Go.unl.edu/ProHort. A houseplant webinar series will occur on Feb. 27 and Mar. 6 from 10-noon with registration here: https://go.unl.edu/houseplants101.
Nitrogen Studies: With spring nitrogen applications around the corner, perhaps you are interested in testing different rates, timing, or inhibitors on your farm? On-farm research is a great option to consider! For some specific precision nitrogen studies (including inhibitors), there are stipends of $1300 available to producers interested in those studies. More info: https://cropwatch.unl.edu/precision-nitrogen-management-farm-research-project. There’s also a partnership with the Upper Big Blue NRD where those interested in conducting nutrient management or cover crop studies may receive $300 in reimbursement costs. If you’re interested in a study like this, please let me know. Next week I’ll share on nitrogen rate and timing results.
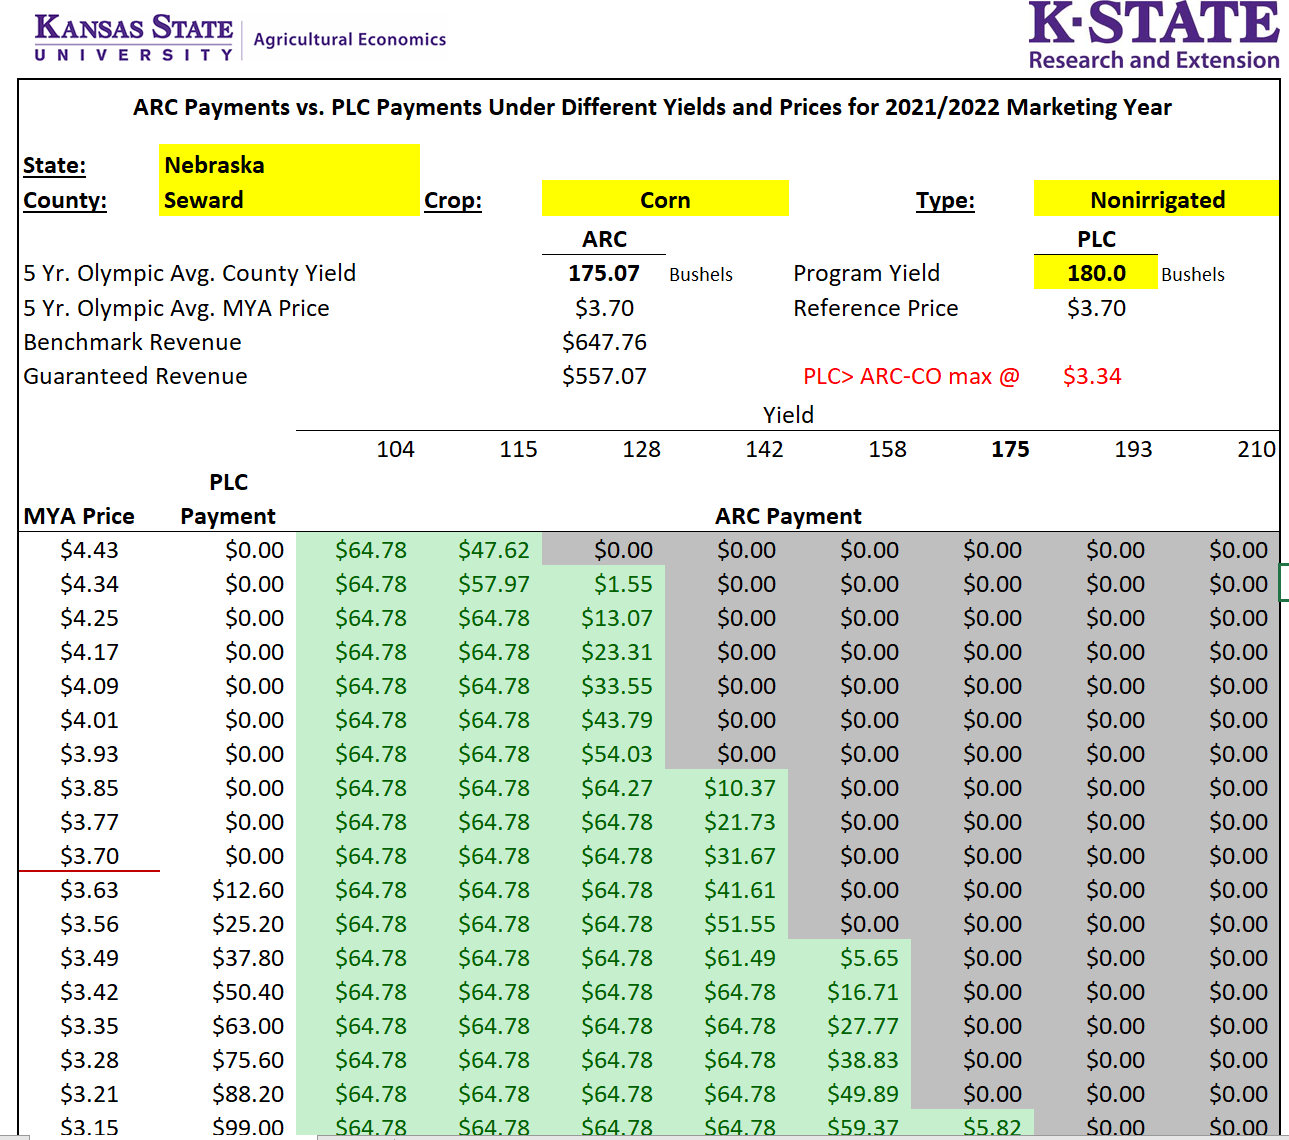
Farm Bill: Another tool that may be more visual in helping you make these decisions is the K-State tool at: https://www.agmanager.info/ag-policy/2018-farm-bill/tradeoff-between-20212022-arc-and-plc and I added it to my Farm Bill Decision Tools blog post. It shows you in one chart what happens with potential ARC-CO or PLC triggers by crop depending on what market year average price does or what county yield does. It doesn’t allow you to put in a historical irrigated percentage (HIP), so you need to consider that when selecting ‘irrigated’ or ‘nonirrigated’ in the tool. With it being in one chart, visually, perhaps that would help some of you more? It honestly doesn’t change what I’ve shared with you before, but it seems people are really struggling with this decision, so if you need another way to visualize what to do, it may help. Ultimately, no matter what tool is used, PLC is favored most often in corn, milo, and wheat. Soybeans often could go either way, and likely there may be no payment for soy or corn unless something substantial happens with MYA price or county yields. If you’re really on the fence, it may be helpful/wise to just split decisions between the two programs for different farms? For counties where there’s split irrigated/non-irrigated payments, particularly in areas that are drought-prone, look at what county average yield will trigger ARC-CO for your specific county using the tool. Crop insurance and marketing are ultimately a huge chunk of risk management too. Ultimately, the decision is up to you and no one can predict prices/yields. This information is just shared as a way to hopefully help with your decision making.
I still haven’t heard/seen that 2020 county average yields have been released for me to help anyone with looking at ARC-IC. From the past, we needed around 20% farm level yield loss compared to county average yield for ARC-IC to trigger. So, for those with significant yield loss from wind events, depending on how your farms are grouped, it still may be something to look at. Hopefully county average yields will be available soon.


JenREES 2/14/21
Cold Weather and Livestock: This week I found gratitude time and again for a warm home. Thinking of those who haven’t been as fortunate. Have also thought about our livestock producers taking care of animals. In the unfortunate event of livestock losses, please document/take photos in the event of any disaster declarations for livestock indemnity payments (LIP).
Crop/Livestock Systems On-Farm Research Study: At last week’s cover crop and soil health conference, Ken Herz shared on his family’s on-farm research study. I’m so proud of and grateful to the entire Herz family for their partnership in this study and for the focus on the economics of an entire system! This study was designed with a system’s perspective incorporating crops, cattle, cover crops in a way that fit many operations in a non-irrigated setting. Their goals were to increase soil organic matter and ultimately determine yield and economics of the entire system. The crop rotation is Wheat (with cover crop planted into stubble after harvest), Corn, Soybean. Cattle graze the cover crop in the winter and also graze the corn residue. No-till wheat prior to corn for increased moisture saving and yield is common in this part of the State as is planting a cover crop into wheat stubble for grazing. The questions I hear include:
1-What moisture and potential yield am I giving up to the successive corn crop if I plant a cover crop into my wheat stubble?
2-If there’s a yield loss in the successive corn crop, do the economics of grazing the cover crop offset that loss?
We had three treatments and two locations (Location 1 had a cool-season cover crop and Location 2 had a warm-season one). The treatments are: ungrazed wheat stubble, ungrazed cover crop, and grazed cover crop. We’ve collected soil property, moisture, nutrient, and health data; yield and moisture of each crop; cover crop biomass; grazing days; and economics.

Location 1 in Nuckolls county began in 2016 with a cool season cover crop planted after wheat was harvested and manure applied. Three-year analysis showed no difference in soil physical properties (bulk density and compaction) amongst treatments. There was greater total microbial and fungal biomass in the grazed cover crop treatment (indicators of improved soil health). Interestingly, the ungrazed wheat stubble is the most economical treatment at this location. Reasons: cost of hauling water for grazing, numerically higher yields in the ungrazed wheat stubble, variable biomass in cool season cover, and a large yield hit to the 2018 soybeans in the grazed cover crop treatment during a dry year. In 2018, to the line there was a stress difference in the soybeans and that treatment read drier via soil moisture sensors. They’ve been conservative with grazing so at the time we couldn’t explain it. In taking soil health tests in year 3, we realized how greatly the microbial biomass had increased where cattle grazed. Our hypothesis is microbes broke down the remaining residue exposing soil to more evaporative losses resulting in less soil moisture and less yield for soybeans in the grazed treatment during a dry year. It’s now on our radar when grazing occurs to get cattle off even sooner to account for feeding the microbes too.
Location 2 in Webster county began in 2018 with a warm season cover crop. Over 4 tons of biomass allowing for 91 grazing days, not hauling water, and no successive crop yield differences all led to the grazed cover crop being the most economical treatment at this location.
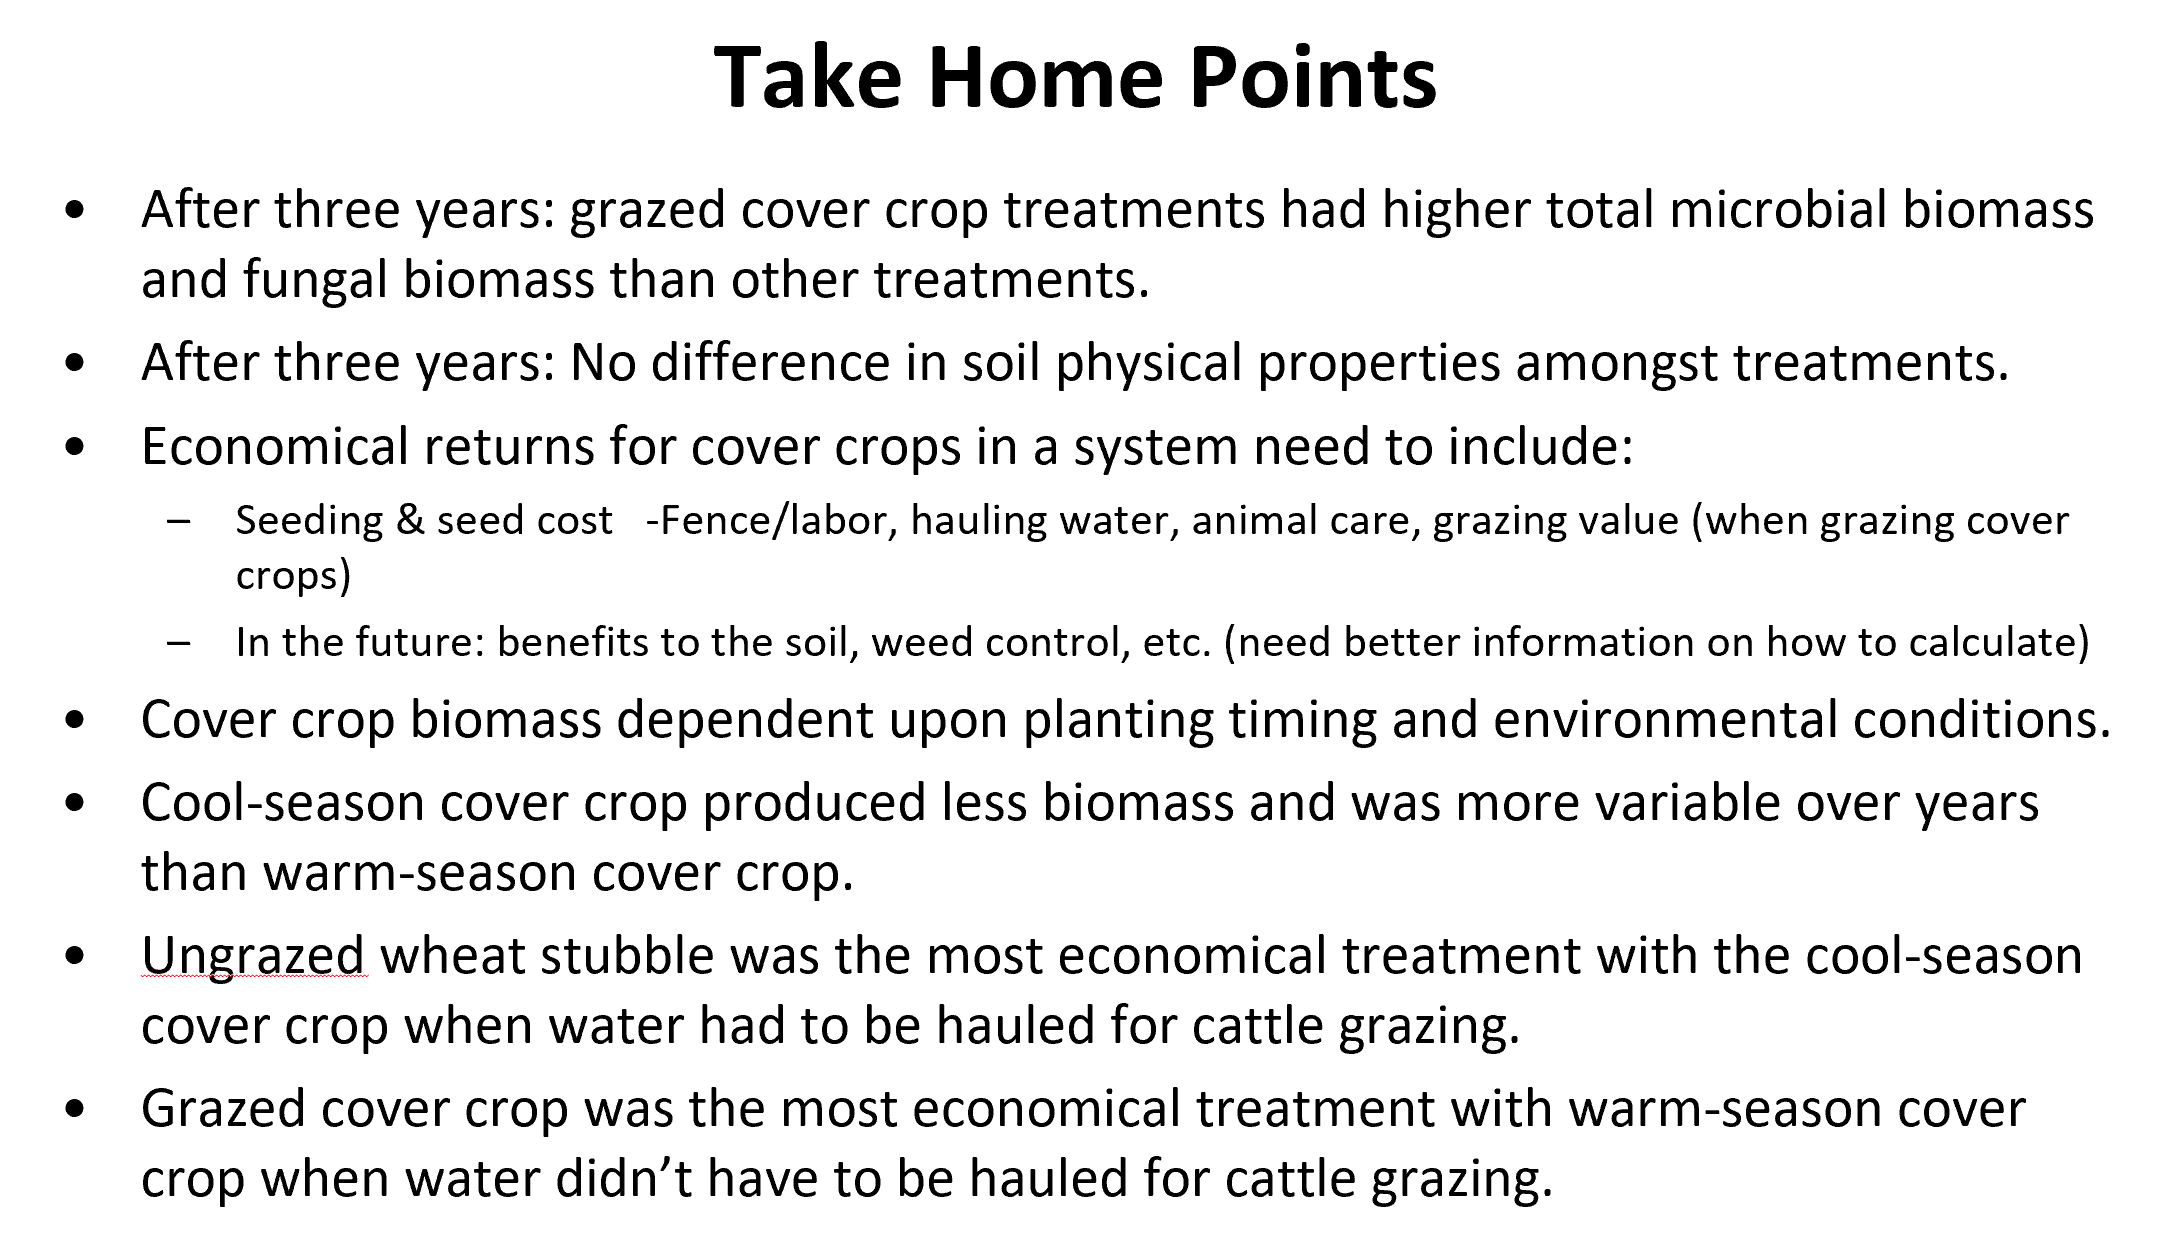
Take home points: it’s important to add all the components when looking at economics. Grazed cover crop treatment at Location 1 would look better if we didn’t include the large cost of hauling water and if there was more cool season biomass allowing for more grazing days. The differing results at the two locations showed the influence of cover crop biomass and importance of including value of grazing; fencing/water/labor costs for livestock; cover crop costs; and successive crop yields in system economics. It’s easy to make assumptions that a certain practice is profitable! Location 1 will hopefully continue another 6 years switching the cool season cover crop to a warm season one to compare economics on the same field. We’re curious if the warm season cover will increase biomass and grazing days enough to outweigh the water hauling costs and show a benefit to the grazed cover crop treatment, or if the ungrazed wheat stubble will remain the most economical for this field location.
Regarding cover crop economics, it could be helpful to determine a consistent way for assessing a dollar value for potential benefits such as aiding in weed and erosion control, nutrient uptake, etc. This may aid conversations with landlords and lenders for those desirous to try them. Without livestock value, currently on paper, there’s really only costs.
(End of news column. Photos below are additional information.)

2017 Corn: The economic analysis had no input differences for any of the treatments for corn production. UNL Corn Budget 21 (EC872, 2017 Nebraska Crop Budgets, revised Nov. 2016) was the closest that fit this operation, so a total cost/ac of $459.60/ac and a market year average price of $3.15/bu was used. In the previously established grazed cover crop treatment, cattle grazed on the corn stalks. A $5/ac cornstalk rental rate value was assessed to this 9.6 acre area. This rate assumes water, fencing, and the care of the animals.
2018 Soybean: The inputs were the same for the soybeans planted into all the previous treatments. UNL Budget 56 (EC872, 2018 Nebraska Crop Budgets, revised Nov. 2017) was used, which stated a $315.82/ac total cost. A market year average price of $7.40/bu was used.
2019 Wheat: The inputs were the same for the wheat planted into all the previous treatments. UNL Budget 70 (EC872, 2019 Nebraska Crop Budgets, revised Nov. 2018) was used which stated a $247.04/ac total cost. A market year average price of $3.65/bu was used. 2019 Cover Crop: Cost for spraying the wheat stubble was $18 ($9/ac application and $9/ac herbicide cost). Costs for the non-grazed cover crop treatments were $49.42/ac ($31.42/ac for seed and $18/ac for drilling). Costs for grazed cover crop treatments were $64.00/ac ($49.42/ac for the cover crop seed and planting, $5/ac for fencing, and $9.58/ac for water). Water cost was calculated based on hauling water (5.75 water trips at $16/trip which included cost of water). Costs for the grazed cover crop treatments equaled $54.78/AUM (49.42*9.6=474.43/8.66AUM from what was grazed=54.78). Value of the forage is estimated to be $84.80/ac (based on rental rates of $53/pair/month (1.25 AUMs) or $42.40 AUM). Forage production was limited in fall of 2019 compared to 2016 due to wet summer that delayed wheat harvest which delayed cover crop planting. Cool fall led to less growth. Only 8.66 AUM was achieved with the 2019 cover crop compared to 19.03 AUM with the 2016 cover crop.
2020 Corn: The economic analysis had no input differences for any of the treatments for corn production. UNL Corn Budget 23 (EC872, 2020 Nebraska Crop Budgets, revised Nov. 2019) was the closest that fit this operation, so a total cost/ac of $452.10 and a market year average price of $3.51 was used. In the previously established grazed cover crop treatment, cattle grazed on the corn stalks. A $5/ac cornstalk rental rate value was assessed to this 9.6 acre area. This rate assumes water, fencing, and the care of the animals.
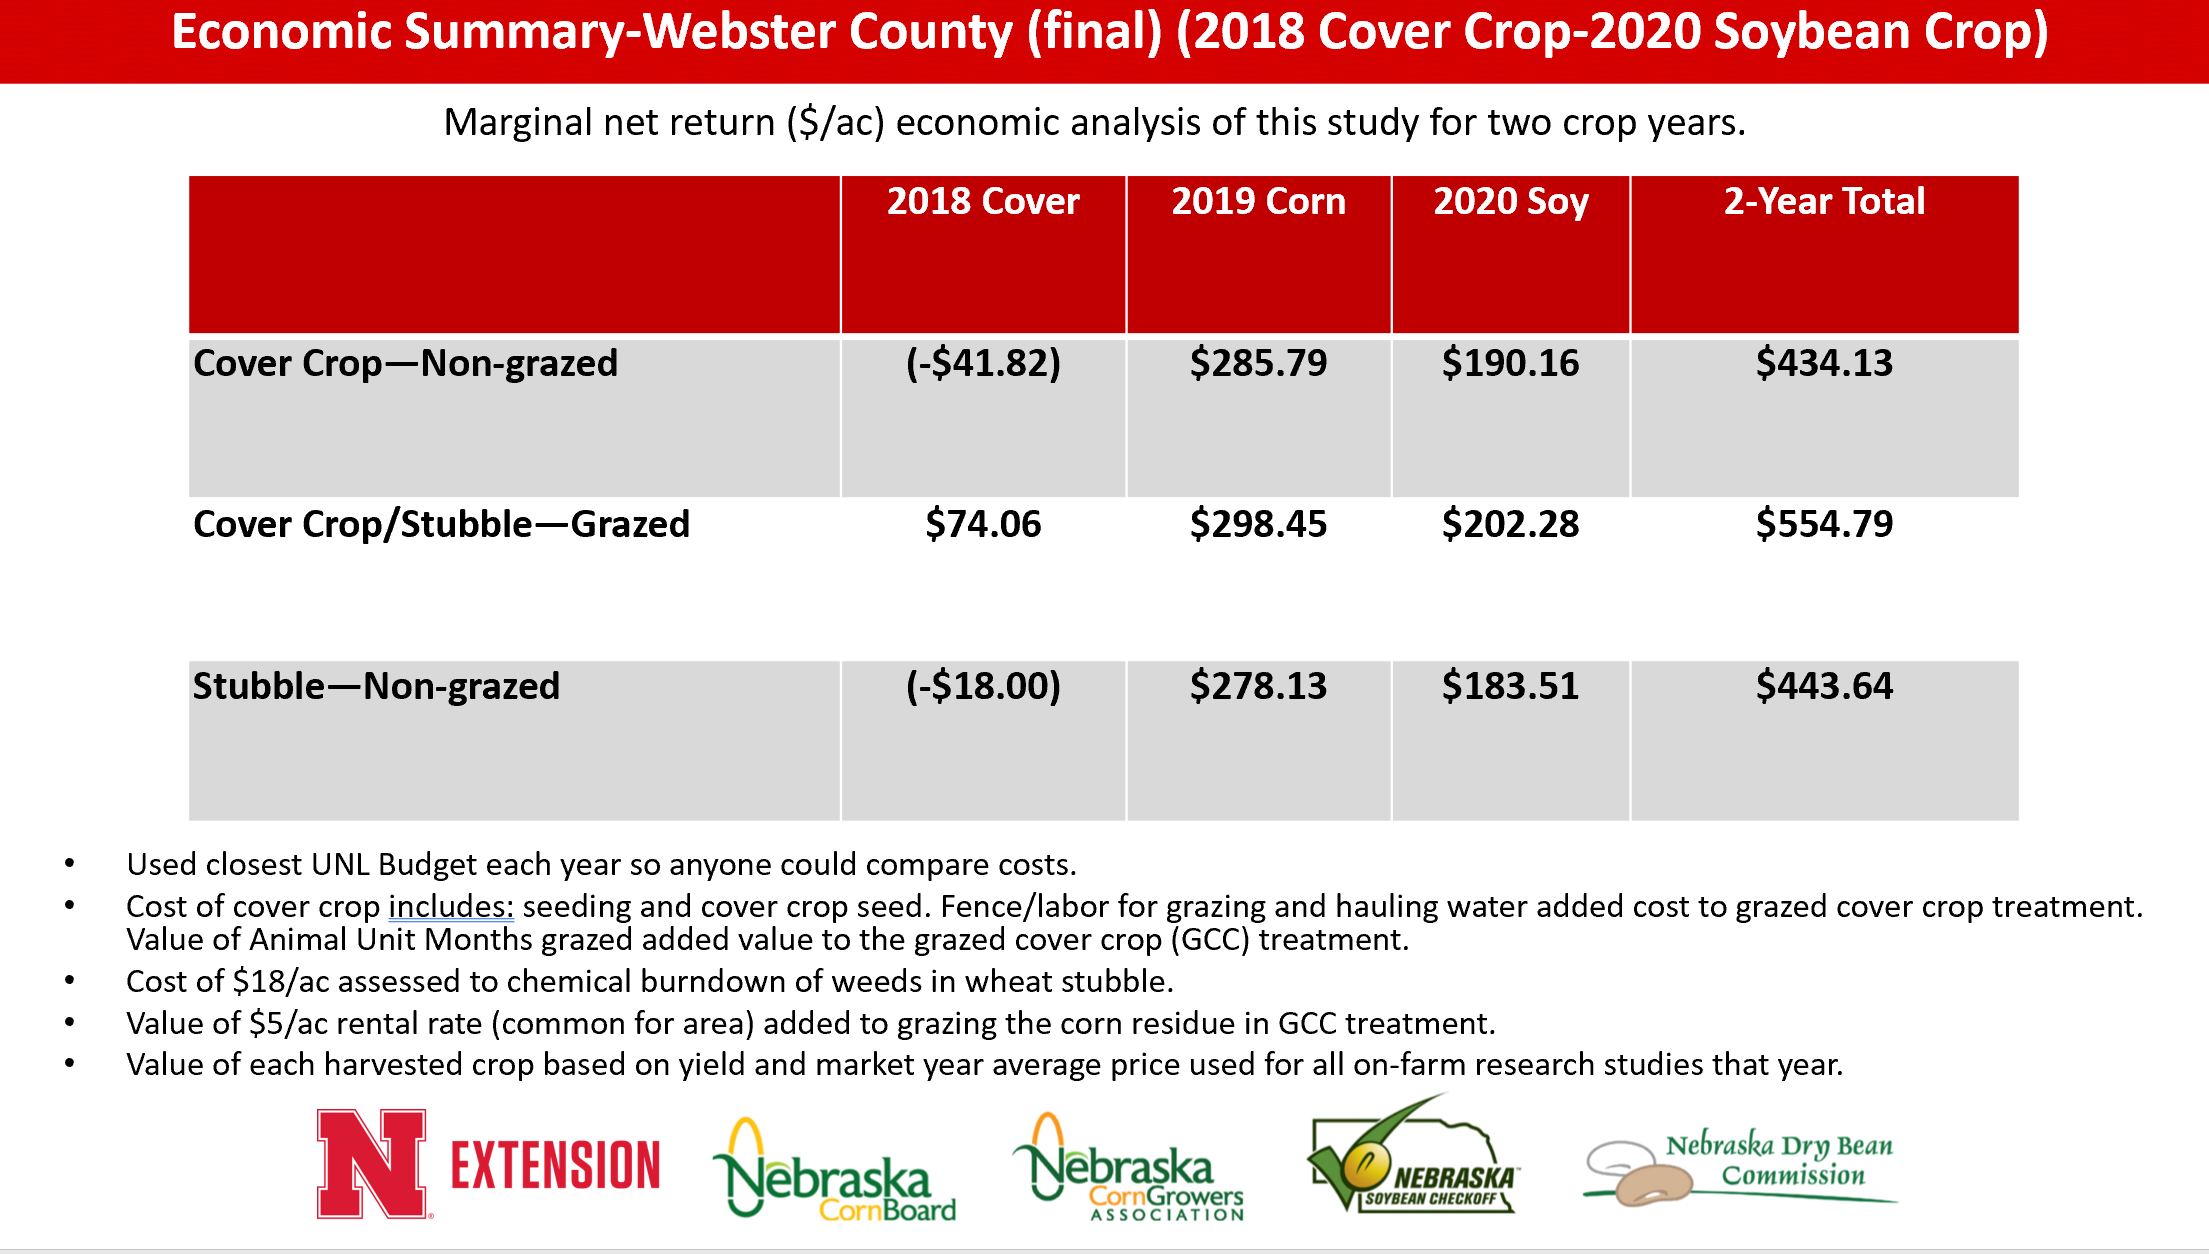
cover crop treatments were $41.82/ac for cover crop seed and drilling. Costs for the grazed cover crop
treatments were $47.74 ($41.82/ac for cover crop seed and drilling, $5/ac for fencing, and $0.92/ac water).
Grazing benefit is $6370 (using a value of $2.00/head/day) for the 52.3 acres grazed. The resulting net
benefit is $74.06/acre.
2019 Corn: The economic analysis had no input differences for any of the treatments for corn production.
UNL Corn Budget 23 (EC872, 2019 Nebraska Crop Budgets, revised Nov. 2018) was the closest that fit this
operation, so a total cost/ac of $438.08/ac and a market year average price of $3.83/bu was used. In the
previously established grazed cover crop treatment, cattle grazed on the corn stalks. A $5/ac cornstalk
rental rate value was assessed to this 52.3 acre area. This rate assumes water, fencing, and the care of the
animals.
2020 Soybean: The economic analysis had no input differences for any of the treatments for soybean
production. UNL Soybean Budget 58 (EC872, 2020 Nebraska Crop Budgets, revised Nov. 2019) was used
which states a $392.90/ac total cost. A market year average price of $9.50 was used.
JenREES 2-7-21
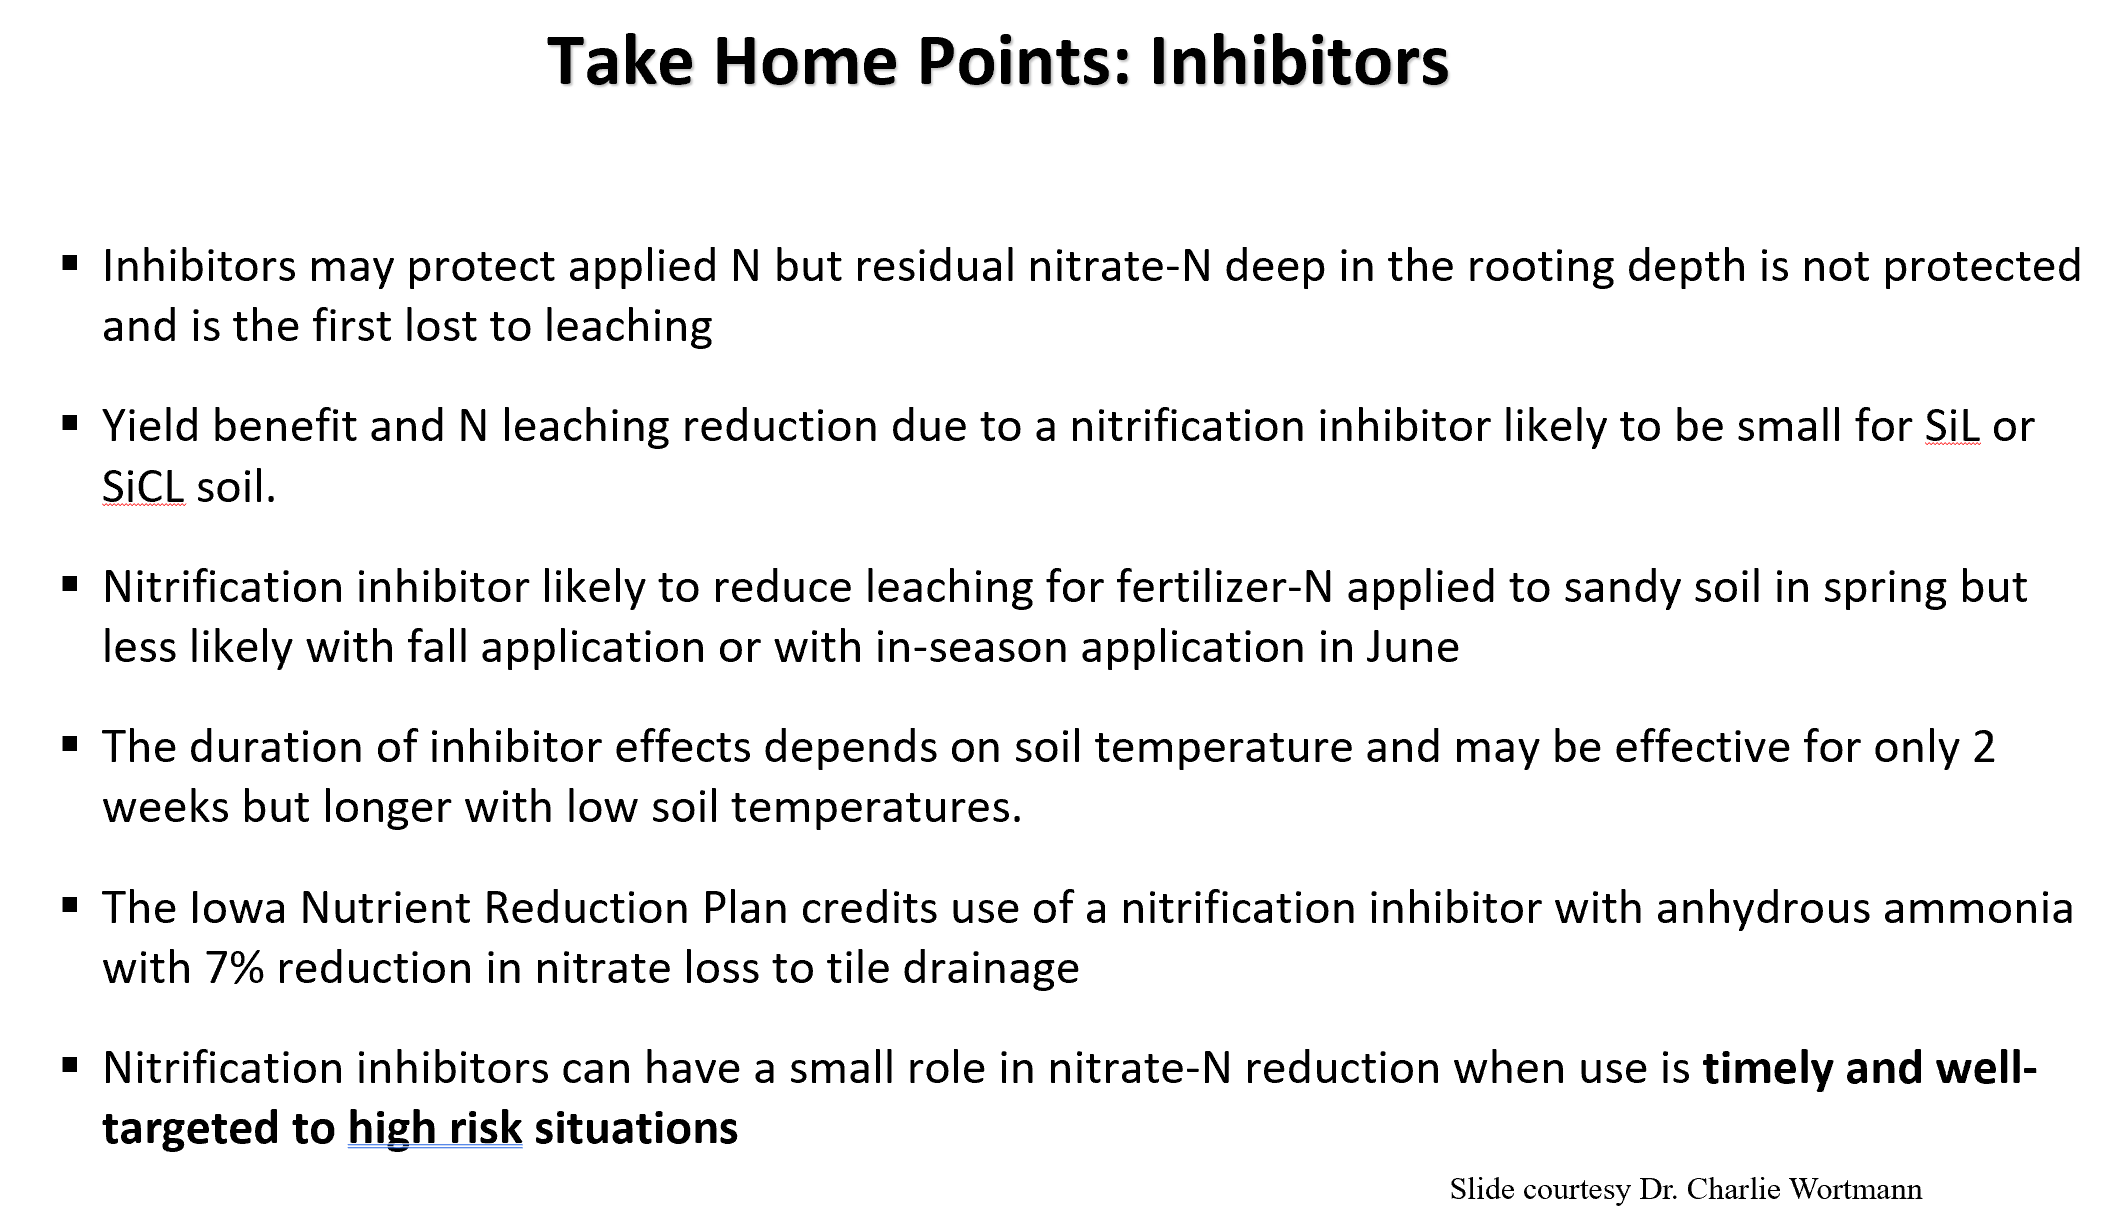
Nitrification Inhibitors: For the next several weeks I will share data from on-farm research studies. Nitrification Inhibitors are best thought of as an insurance policy against loss of applied ammonium-based fertilizer due to excess rain in the first month or so after fertilization. For spring applications, some active ingredients have been proven by research to slow the conversion of ammonium to nitrate for at least two weeks, with a range of 1-6 weeks, depending on soil temperature. They are one tool (not a silver bullet), when used at right place and time, for aiding in nitrogen management. To summarize the research below, nitrification inhibitors are less likely to have a significant impact on increasing yield and reducing nitrate leaching in silt loam and silty clay loam soils as compared to sandy soils.
An ongoing study at UNL’s South Central Ag Lab (SCAL) near Clay Center is conducted on silt loam soils, common in the UBBNRD. The majority of the study at SCAL compared Spring pre-plant anhydrous vs. side-dress application with and without the use of nitrification inhibitor N-Serve® (nitrapyrin). A yield increase due to nitrapyrin applied pre-plant was observed in 6 of 28 years with a mean yield change of 2 bu/ac/year. Only 1 of 28 years was a yield increase observed when nitrapyrin was applied in season during side-dress application with a mean yield change of 0 bu/ac/year. In this study, they found delayed side-dress N with nitrapyrin could reduce plant N uptake and release N too late, thus it is not recommended to add an inhibitor to nitrogen applied in-season.
In 2019, two York Co. farmers compared spring anhydrous ammonia applications with and without the nitrification inhibitor (N-Serve®). At York location 1, 180 lbs N as anhydrous was applied on April 10, 2019 in ridge-till, silt-loam soil. At York location 2, 160 lbs N as anhydrous was applied on April 8, 2019 in no-till, silt-loam soil. These locations were around 4 miles apart and the previous crop in both was soybean. Soil samples were taken 2” off the anhydrous band down to three feet for both ammonium and nitrate concentrations at V7 growth stage. The results showed the nitrification inhibitor was still slowing the conversion of ammonium to nitrate in 1st foot at York 1 location (longer than would be anticipated for a spring-applied inhibitor treatment), but not at York 2. At both study locations, no yield difference occurred between the check and inhibitor treatments respectively (250 vs. 251 bu/ac at York 1 and 264 vs. 264 bu/ac at York 2).
In 2020, four farmers (3 in York Co. and one in Fillmore Co.) conducted on-farm research inhibitor studies. These studies were in partnership with the UBBNRD. Soil samples for ammonium and nitrate concentration were taken around 6 and 9 weeks post-application based on the protocol provided. Note: with these being inhibitor focused studies, future protocols will have soil tests taken closer to application. With farmers interested in what nitrogen distribution in the profile looks like in the late season, we will also sample then.
At York location 1, 150 lbs N as anhydrous was applied in the fall and spring with and without Centuro®. Soil tests in early May showed less total nitrogen in the third foot for the Spring anhydrous with Centuro® compared to Fall anhydrous with no inhibitor. There were no yield differences between treatments in 2020 (Fall and Spring check yielded 269 bu/ac, Fall with Centuro® 267 bu/ac, Spring with Centuro® 270 bu/ac). This study will continue. The other three locations had yields impacted by the July 9, 2020 wind event. At the Fillmore Co. location, 115 lbs spring applied 32% UAN with and without Instinct® II was compared. There was less nitrate and total nitrogen in the Instinct® II treatment at 2nd and 3rd foot vs. the check and there were no yield differences (both yielded 213 bu/ac). At the York 2 location, four products were compared (44 gal. spring applied 32% UAN as a check compared to the check plus either ammonium thiosulfate (ATS), Biovante™, or Instinct® II. The UAN+ Instinct® II had less nitrate and total nitrogen in the 3rd foot than the UAN+ Biovante™. The UAN+ATS treatment yielded significantly more than the check (215 bu/ac vs. 209 bu/ac) with no differences amongst the other treatments (212 bu/ac each). At the York 3 location, 45 gal spring applied 32% UAN was compared to a producer-developed concoction containing humic acid, sugar, and ATS. There was more nitrate, ammonium, and total nitrate in the inhibitor concoction than the check at the 3rd foot with no yield differences (220 bu/ac check vs. 221 bu/ac inhibitor concoction). These and other Nebraska on-farm research studies will be presented Feb. 25-26 both virtually and in-person. You can learn more and register here: https://go.unl.edu/h83j.