Category Archives: Irrigation Scheduling
JenREES 8/28/22
Last Irrigation: This really is dependent upon everyone’s individual soil moisture situation by field, crop development stage and crop rooting depth for that field. I have a fairly proven method I’ve used for watermark sensors, but being there’s so many different irrigation scheduling tools used, it won’t be applicable to everyone. We’re most likely done irrigating most ‘normal season’ corn in the area at this point. Corn at ½ milk needs approximately 13 days and 2.25” to finish. Corn at ¾ milk needs about 7 days and 1” till black layer. At this point, we’d say you can draw soil moisture down to 60% of field capacity. If you have the top foot at field capacity for a silt loam soil, there would be at least an inch available in the top foot alone, not accounting for soil moisture in the next several feet. So, you could wait a week and see where soil moisture is and adjust from there.

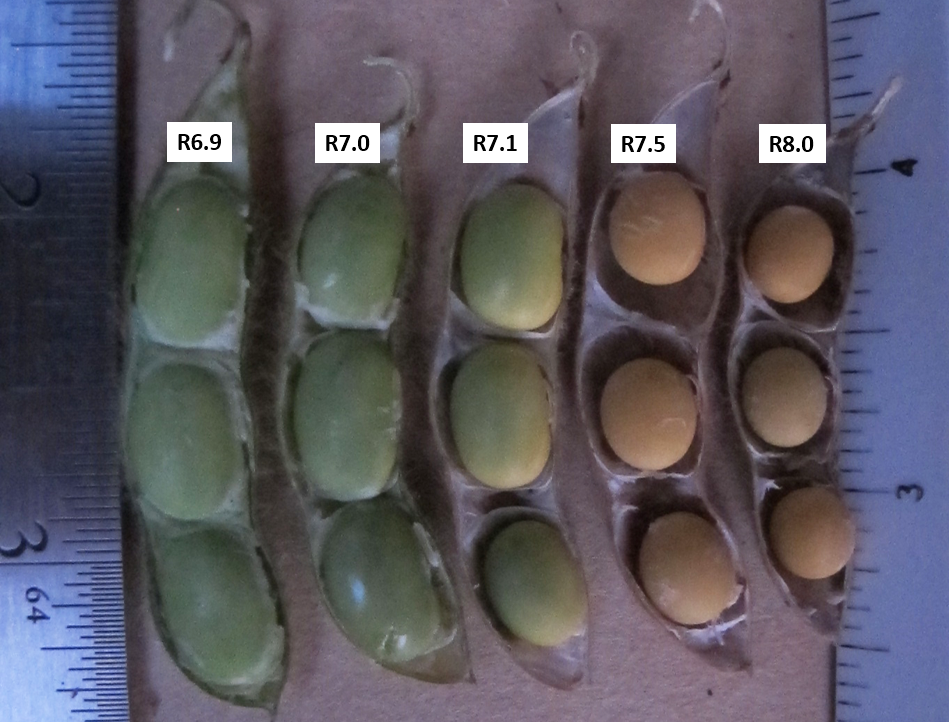
What I said for corn above can also be applied for soybean. I think what’s trickier for soybean is determining the end reproductive stages, especially as we have been conditioned to look at ‘leaf yellowing’ as the beginning of physiological maturity, yet many factors can cause leaf changes. So I feel perhaps a better indicator of maturity is to look at the pods. For soybean development stages from R2 (full flower) to R6 (end of seed enlargement), we are looking at pods at the top 4 nodes of the plant. For R7 (full maturity), we are looking for at least 50% of the plants having one mature pod anywhere on the main stem.
So how do we know a pod is mature? Inside of each soybean pod, there is a whitish membrane around each seed that provides water and nutrients to the seed. A mature pod is considered when the pod membrane no longer clings tightly to seeds in that pod (this is like black layer on corn where the nutrient/water supply is cut off from the kernel forming the black layer). So essentially, if you pull off a pod on the main stem, carefully open it up and look at the white membrane surrounding the seed. If it’s still clinging tightly to it, it’s not quite mature. If you see separation of the membrane and seed, it’s considered mature and will no longer use water.
Soybeans at full seed (R6 end of seed enlargement) need approximately 18 days to maturity or 3.5” of water. At R6.5 (leaves yellowing/pod membranes still clinging to seed) the soybean needs 10 days or 1.9” yet until R7 (physiological maturity), in which the pod membrane has separated from the seed and requires no more water.
Soybean stems typically turn brown shortly after R7 begins, though the stem can remain green longer due to a number of reasons, including fungicide use. The final soybean stage is R8, which occurs when 95% of pods have attained maturity and have a variety-dependent color of brown or tan. Seed moisture in a soybean pod dries down from 70% at R7 to about 13% at R8. This has shown to be around 12 days based on research, but can be faster or slower depending on solar radiation, humidity, temperature, wind speed and soil surface moisture.
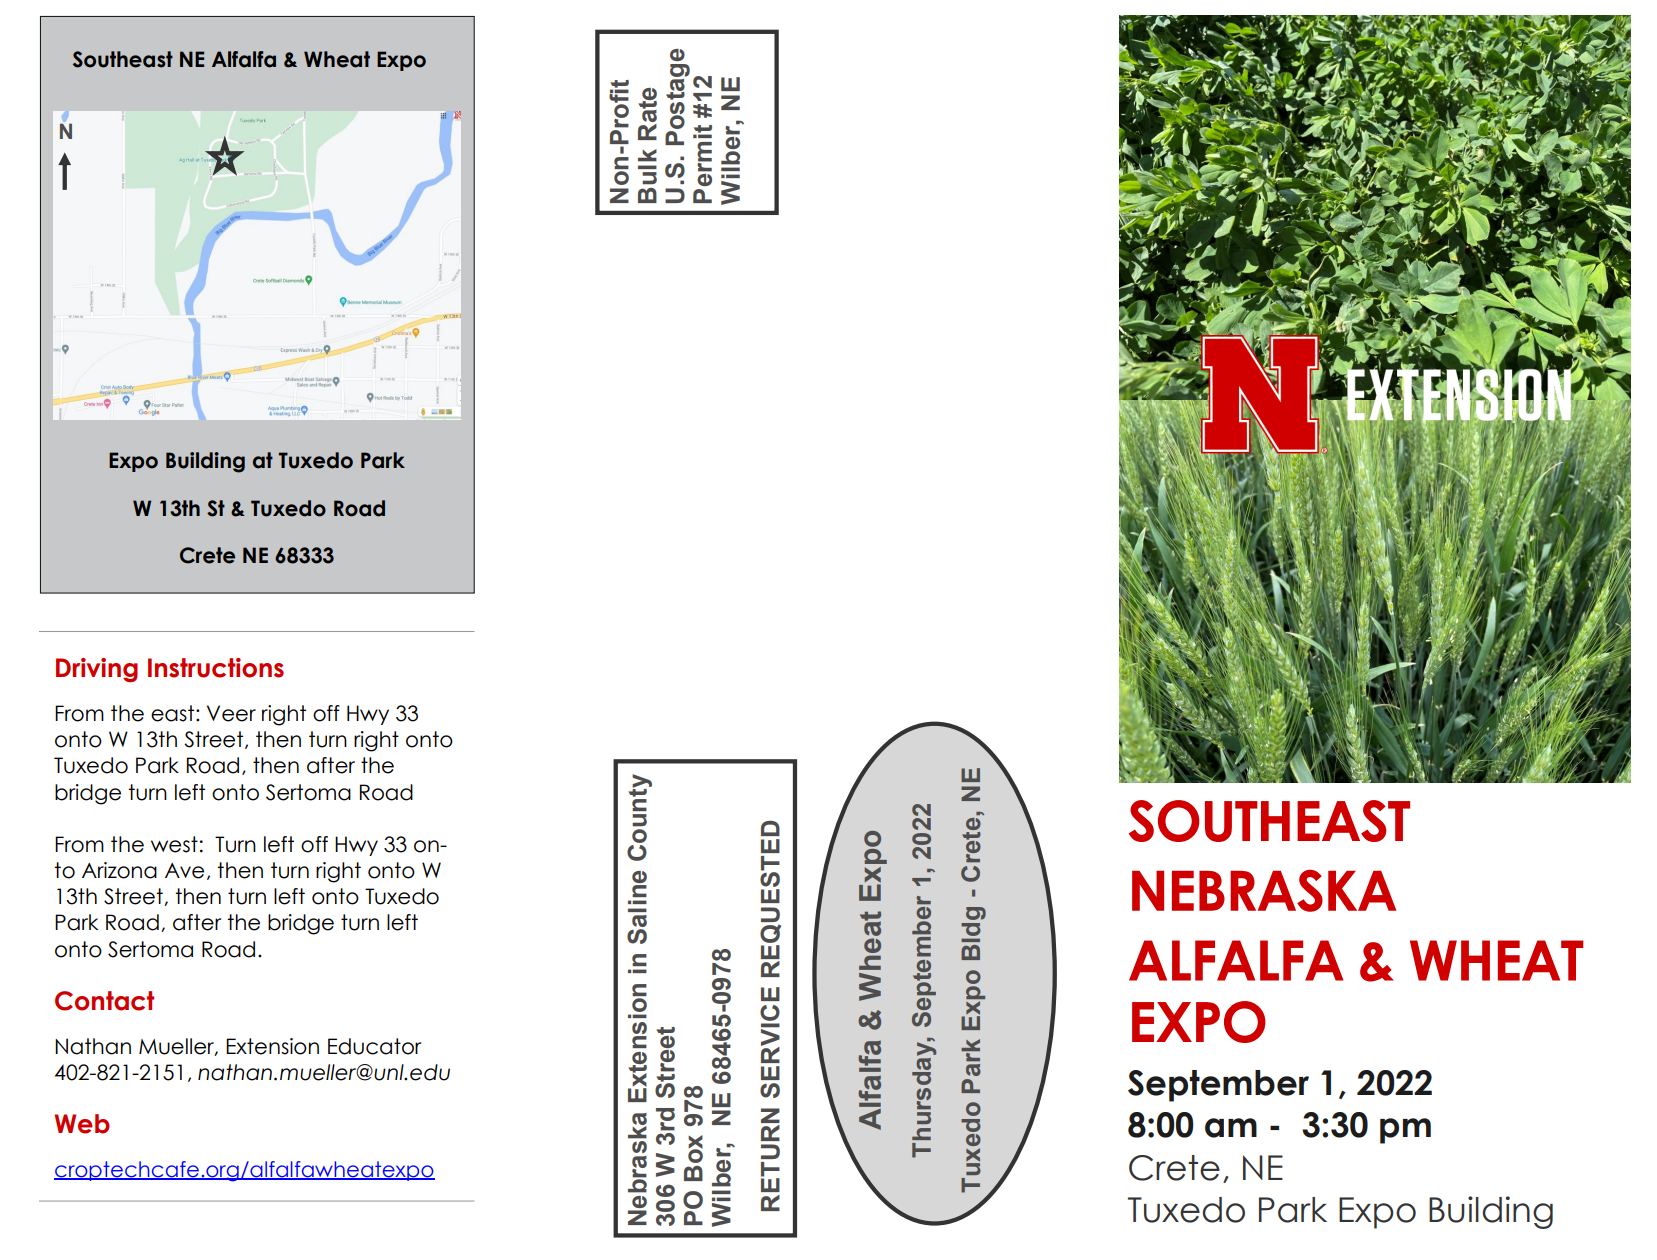
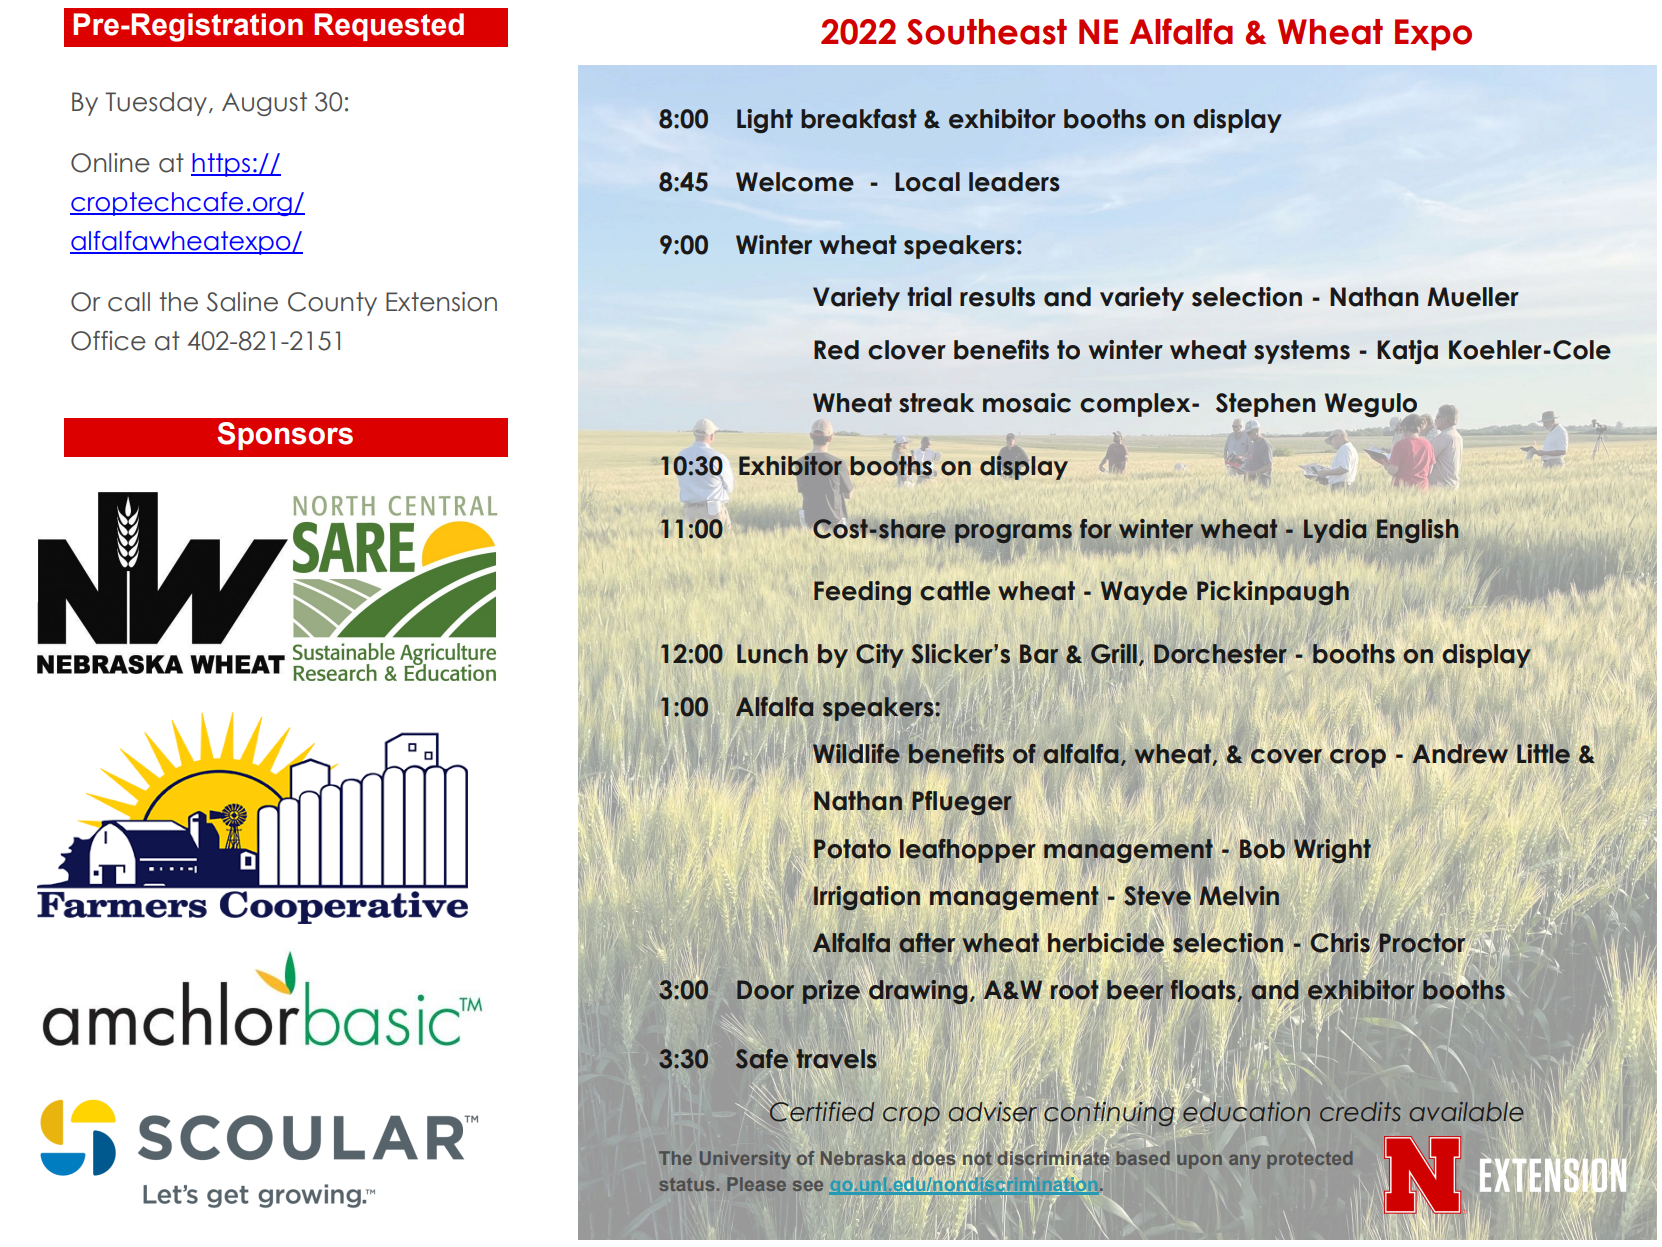
Eastern Nebraska Wheat and Alfalfa Expo will be held Sept. 1 at the Tuxedo Park Exhibition Building in Crete. The expo will begin at 8 a.m. with a light breakfast and exhibitor booths. The educational program starts at 9 a.m. and ends at 3 p.m. Wheat topics in the morning include: wheat variety recommendations, underseeding red clover, hail damage and wheat streak mosaic virus, cost-share programs for growing wheat, and feeding wheat grain to cattle. Topics on alfalfa in the afternoon include: benefits of diverse crop rotations for wildlife, managing potato leaf hoppers, irrigating alfalfa, and herbicide management. There’s no charge but please RSVP to 402-821-2151. More info. at: https://croptechcafe.org/alfalfawheatexpo/.
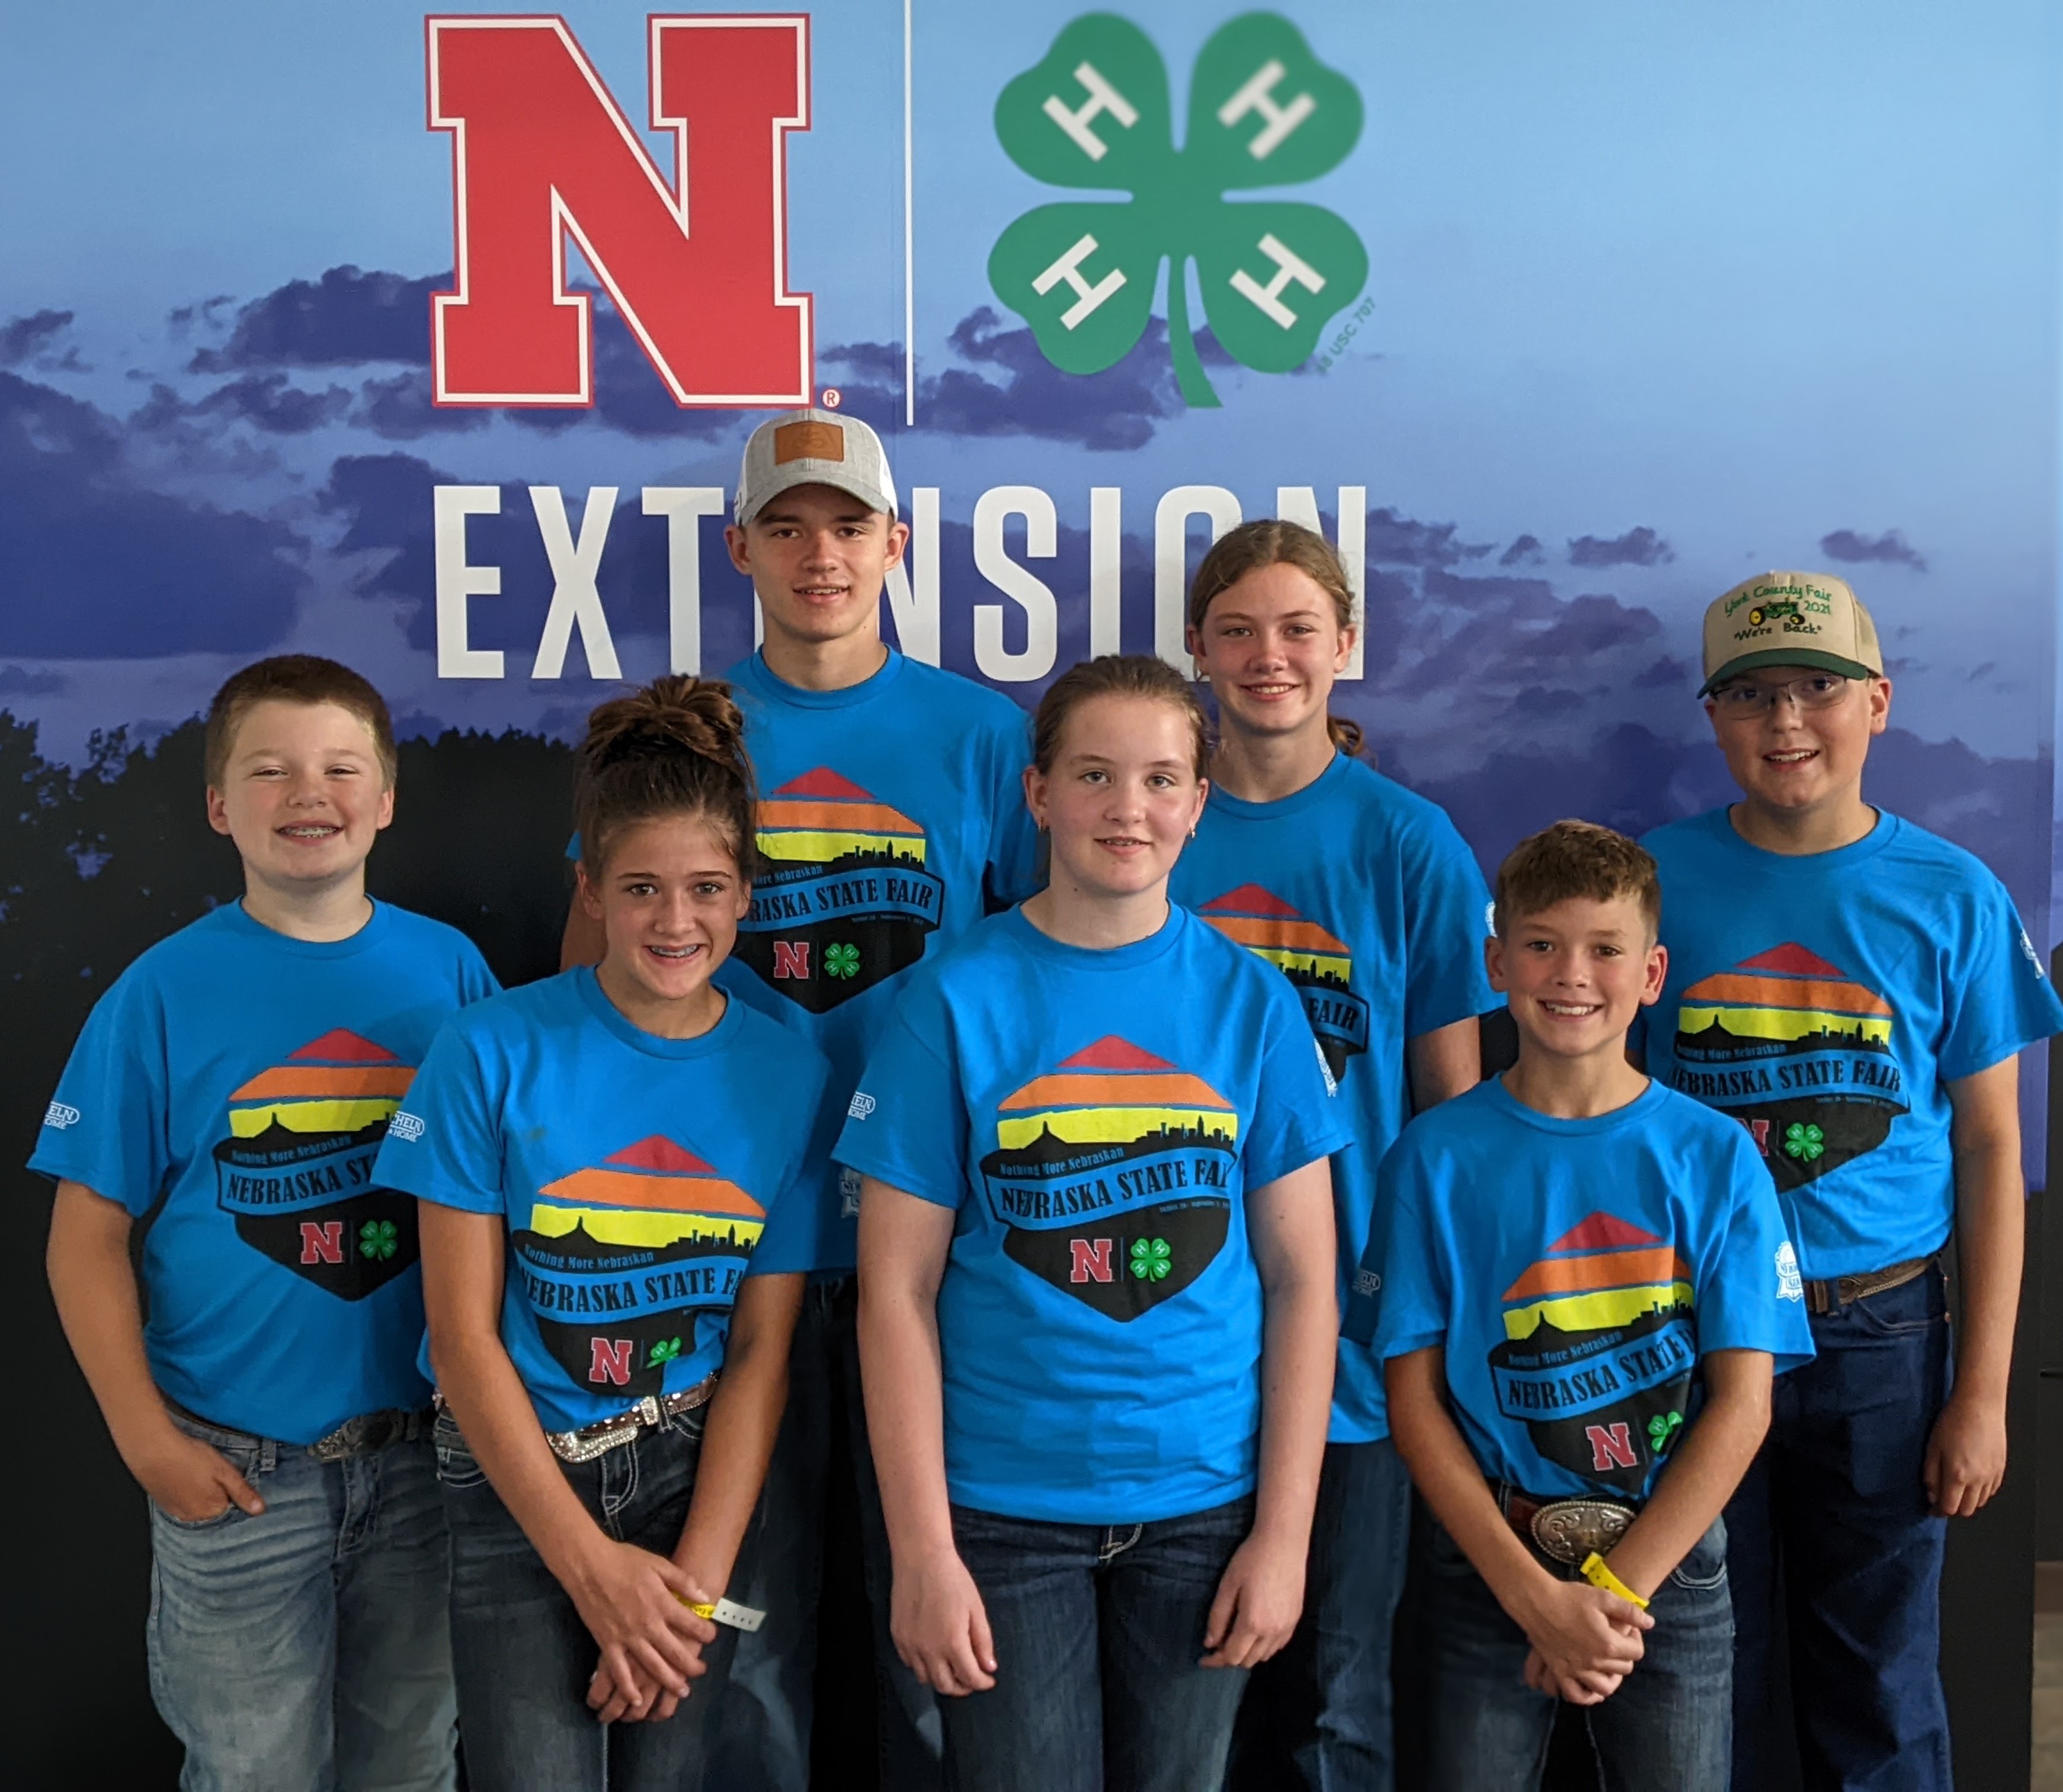
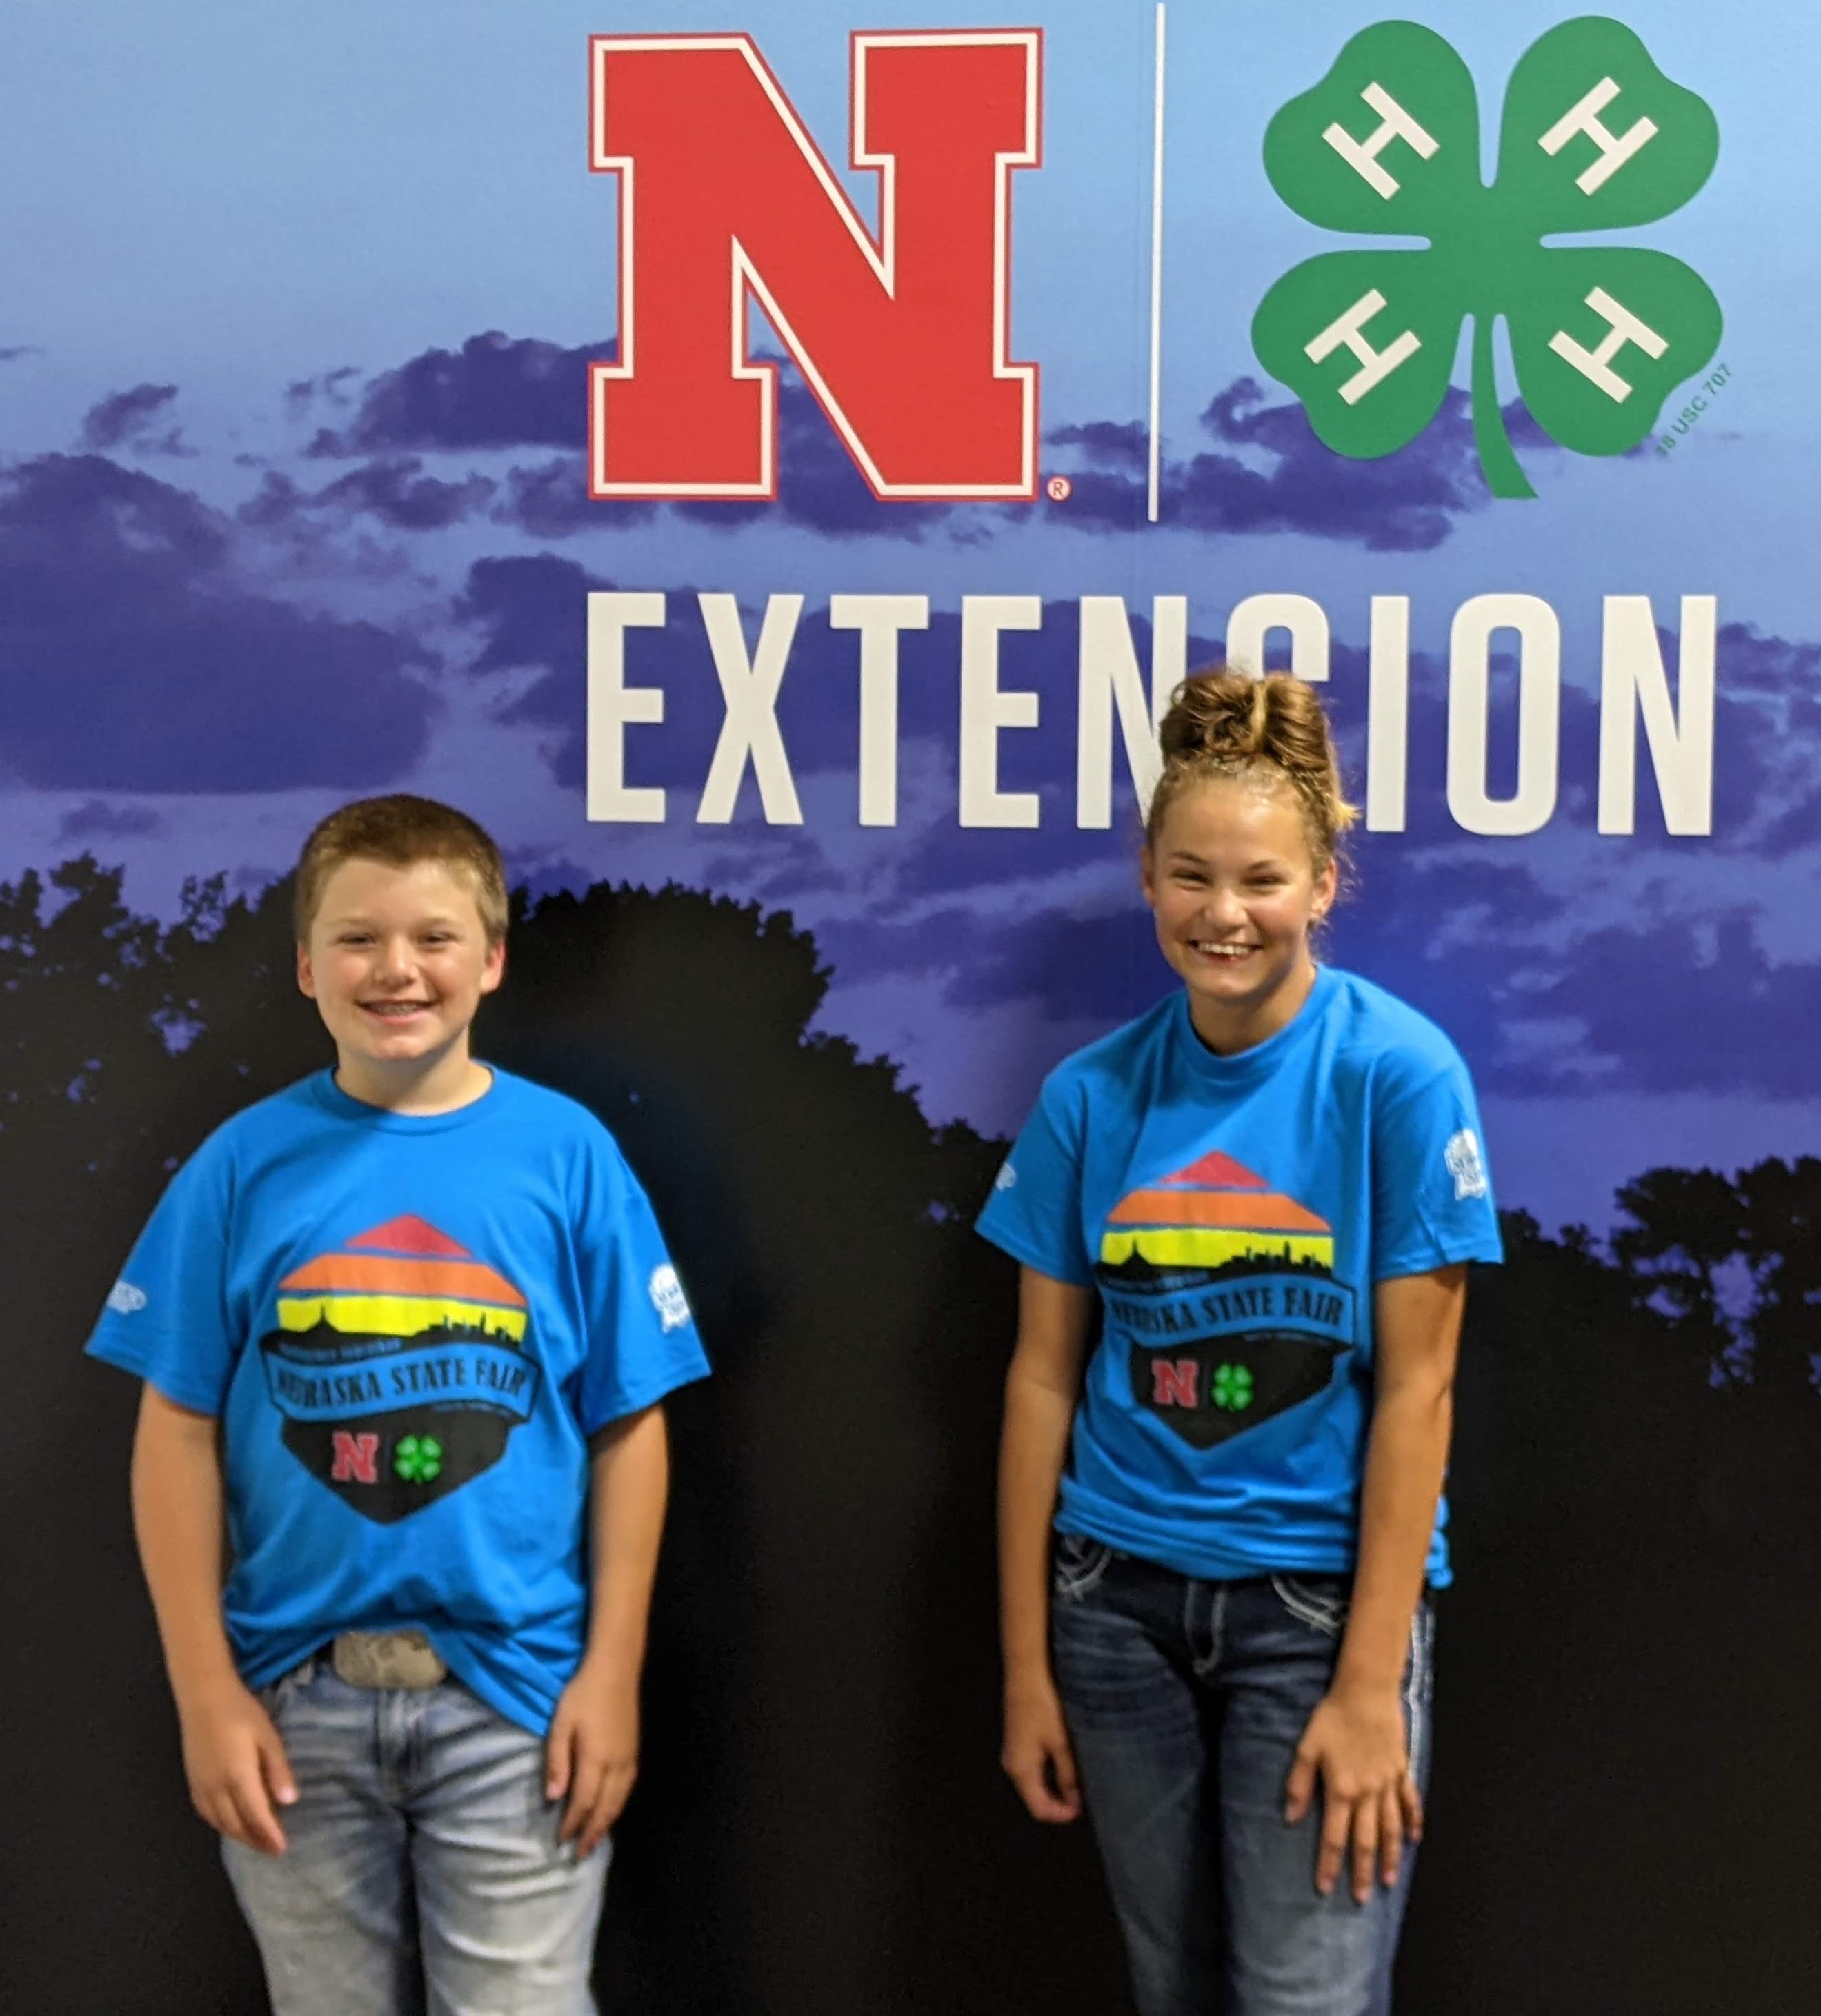
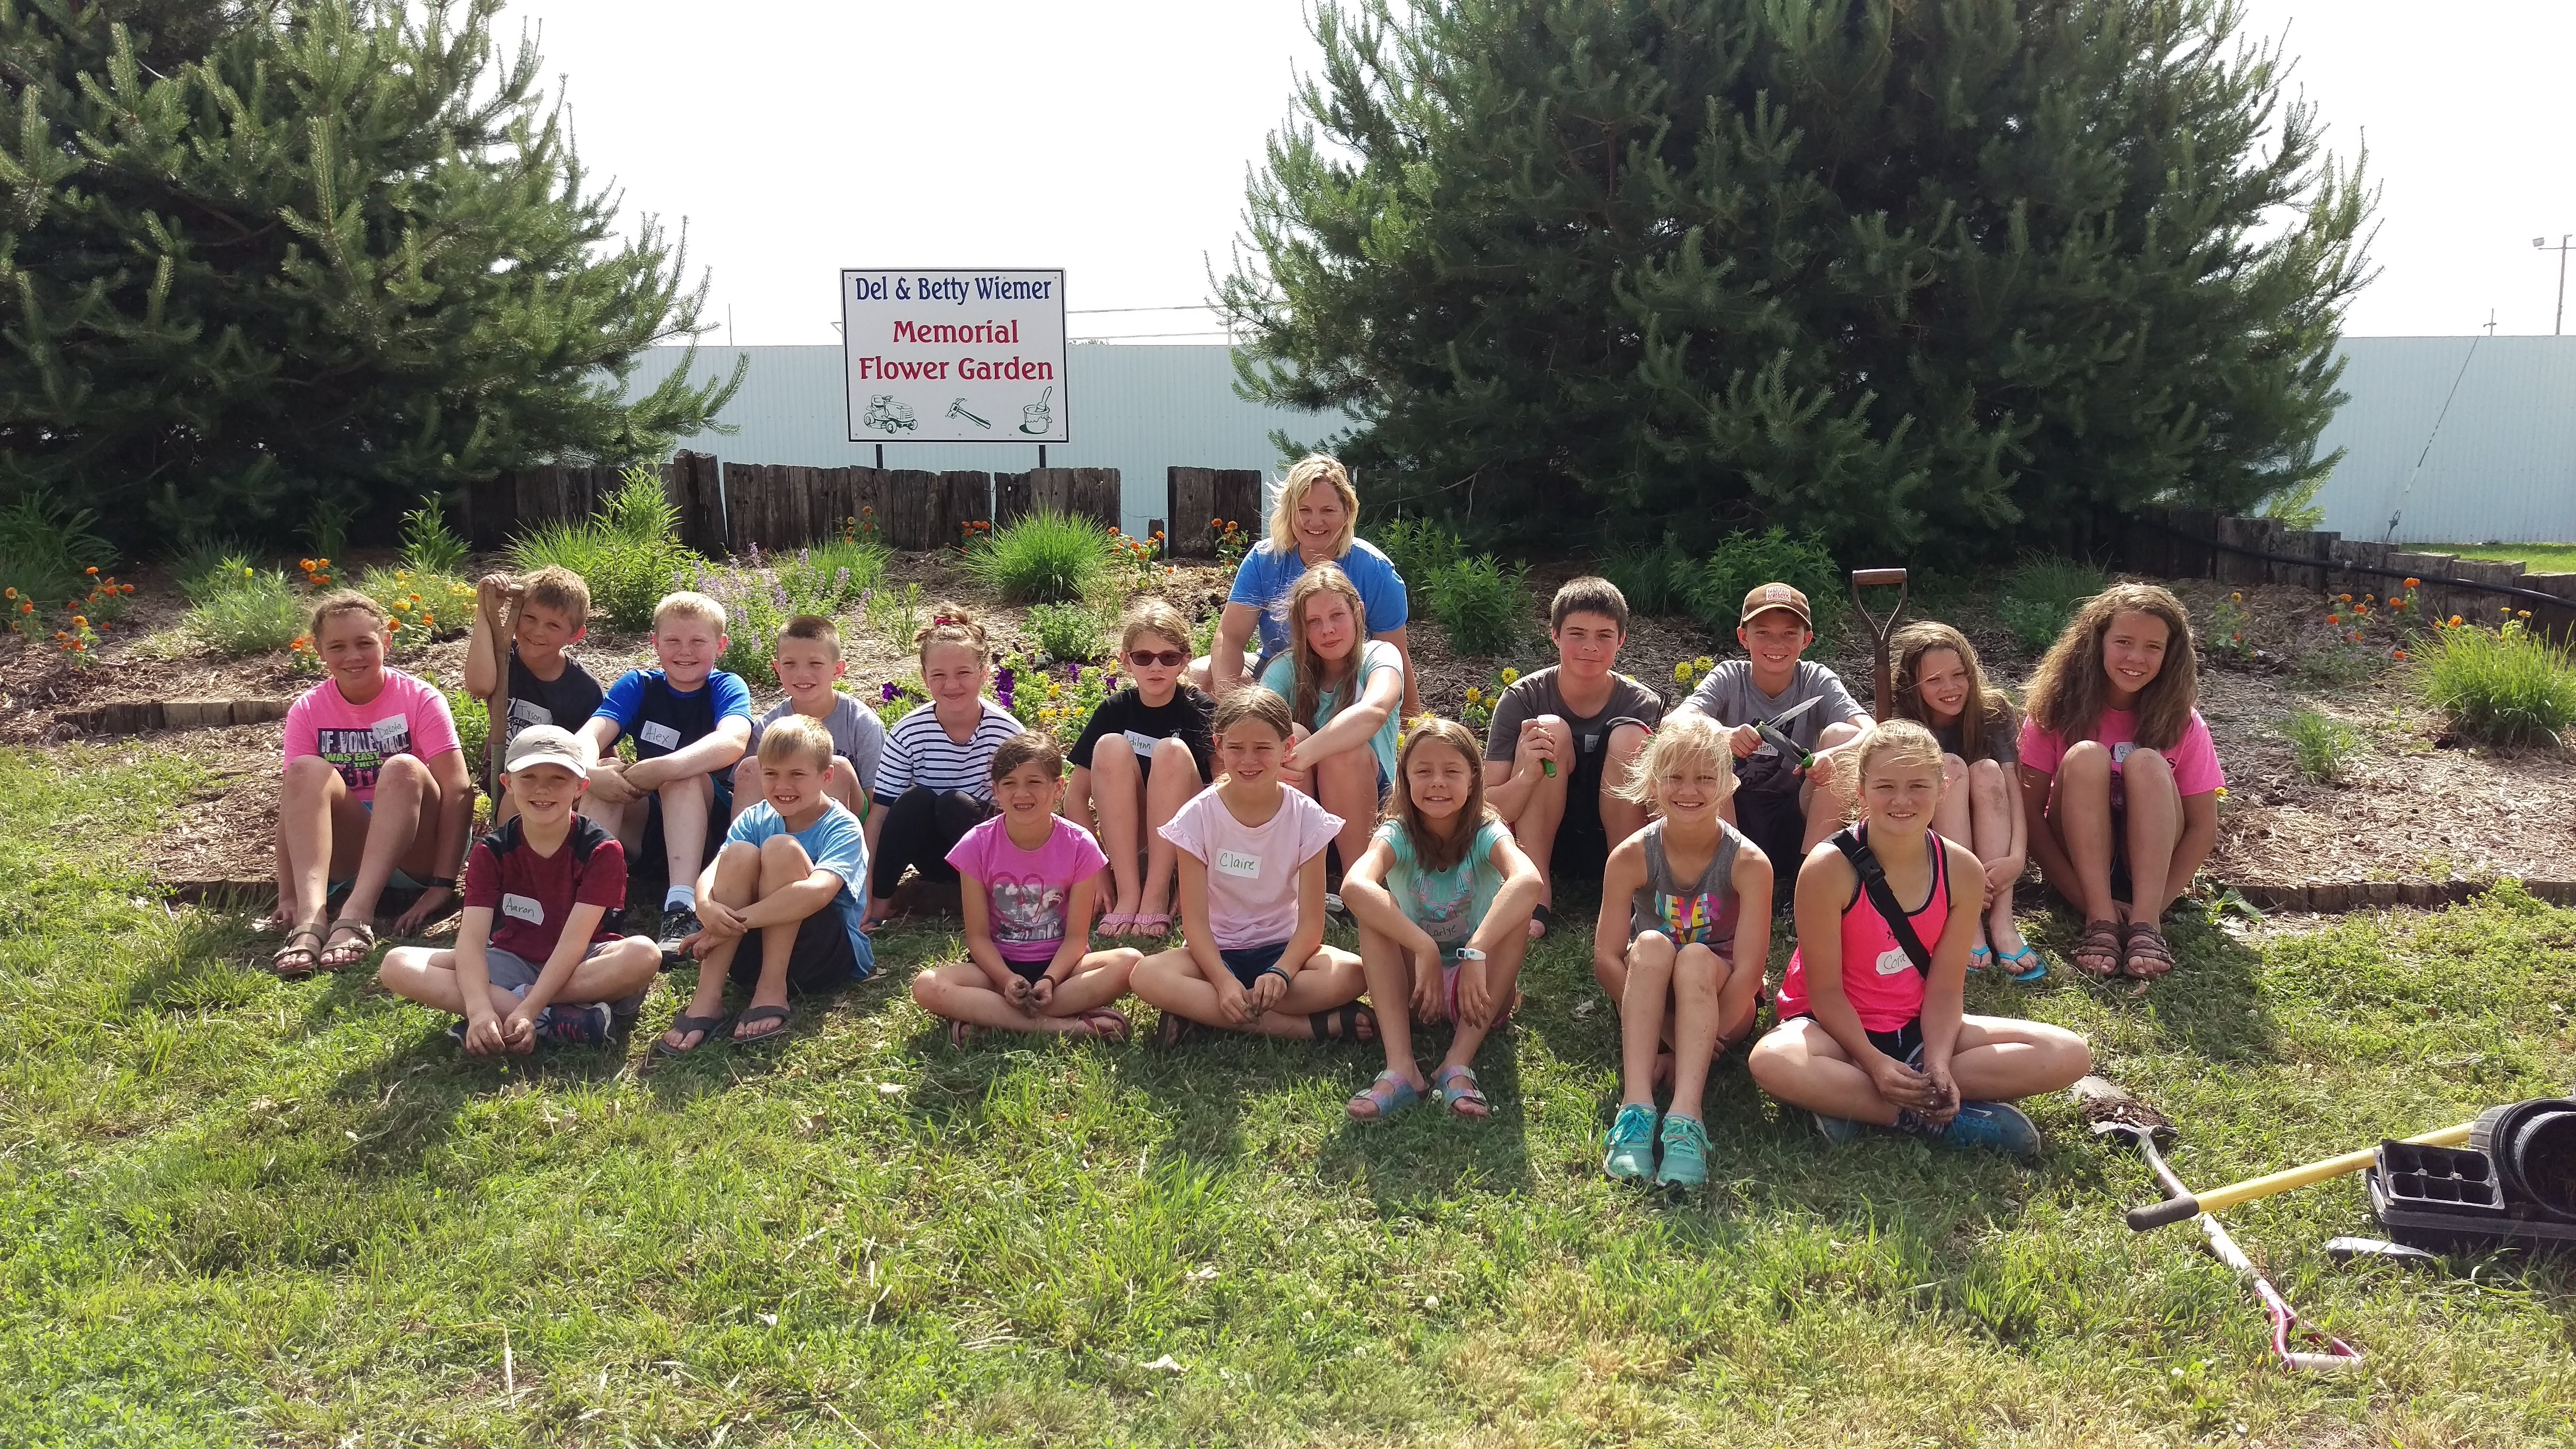
For Fun: Something that brings me great joy is the opportunity to teach youth who love to learn. I’m so blessed to have a wonderful group of families with youth interested in plants and science in my Crop Science Investigation (CSI) group! The youth pictured above were interested and old enough to compete at State Fair for the 4-H Weed and Grass ID (left) and 4-H Horticulture (right) judging contests. They invested a lot of time into studying and what makes my heart so happy is to see them so greatly enjoy learning and having fun while we identify plants! The York teams received 1st and 3rd place teams in Weed and Grass ID with 6 of the 7 youth placing in the top 10. We also had an individual place in the top 10 in Horticulture ID. So cool to see these youth learning these identification skills they will use for life!
JenREES 8/29/21
Congratulations to all the 4-H youth who competed at the Nebraska State Fair this past weekend! The talent of our youth never ceases to amaze me. It’s also so encouraging to see life skills being developed such as public speaking, plant and insect identification, and the responsibility and care for animals.
Also so grateful to receive rain last night! And, that should finish up irrigation, or get it pretty close, for many that didn’t have late-planted crops. It’s really important to know your crop growth stage and to finish well. There’s some fields that are obviously over-irrigated with water standing after this last rain. On the flip side, it’s important to monitor soil moisture and crop growth stages to not stop too soon in spite of the long irrigation season and how tired farmers are. Several questions last week on ‘how’ to finish with irrigations and when physiological maturity occurs in soybeans.
Last irrigation: if you’ve been triggering irrigation during the growing season based on the recommended 35% depletion (average of 90 kpa on watermark sensors), you would have around 1.28” of moisture available in the top 4 feet for the plant in silt loam soils. A consideration for a step-wise approach I’ve used is this: Corn at ½ milk line needs around 13 days or 2.25” to finish the crop to maturity-so subtracting that from 1.28 would be 0.97”. As we consider allowing the soil moisture profile to deplete to 50-60% for recharge over the winter, a person could delay to 40-45% depletion (around 130 kpa average on watermarks) before triggering irrigation the first 7 days and then allow for 50% depletion (around 150 kpa average on watermarks) that last 7 days to finish irrigation for corn.
Soybeans range from full seed (R6 end of seed enlargement) which needs 18 days or 3.5” of water; R6.5 (leaves yellowing/pod membranes still clinging to seed) which needs 10 days or 1.9” yet; or physiological maturity in which the pod membrane has separated from the seed and no more water is needed. The NebGuide, “Predicting the Last Irrigation of the Season”, speaks to yellowing leaves as the beginning of physiological maturity. But the question I kept getting last week was “how yellow is considered yellowing leaves?”. Perhaps a better indicator for today’s varieties would be to also look at the pods. Until the pods reach R7, physiological maturity, the plant is still utilizing water. At R7, at least 50% of the field plants will have one mature pod anywhere on the main stem. A mature pod is considered when the pod membrane no longer clings tightly to seeds in that pod (this is like black layer on corn where the nutrient/water supply is cut off from the kernel forming the black layer). So essentially, if you pull off a pod on the main stem, carefully open it up and look at the membrane surrounding the seed. If it’s still clinging tightly to it, it’s not quite mature. If you see separation of the membrane and seed, it’s considered mature and will no longer use water. There can be a range of pod stages on a plant, but between yellowing leaves and pod color changes, one can get a pretty good idea when R7 has occurred and no additional water is needed for the plants. The timing of the ending R stages in soybean is determined by planting date and varietal maturity group, though the date of R7 can be hastened if water stress and high temperatures prevail in August — something we are seeing this year.
Soybean stems typically turn brown shortly after R7 begins, though the stem can remain green longer due to a number of reasons, including fungicide use. The final soybean stage is R8, which occurs when 95% of pods have attained maturity and have a variety-dependent color of brown or tan. Seed moisture in a soybean pod dries down from 70% at R7 to about 13% at R8. This has shown to be around 12 days based on research, but can be faster or slower depending on solar radiation, humidity, temperature, wind speed and soil surface moisture.
So, for scheduling last irrigation in beans: if we use the same example of having 1.28” of available water at 35% depletion in silt loam soils in top four feet, soybeans would need 2.22” with 18 days to finish at R6 or 0.62” with 10 days to finish at R6.5. Using the stepwise approach, one could again allow the soil moisture to dry down to 40-45% the first week and 50-60% the second week. This also allows room to catch rain like we finally experienced last night.
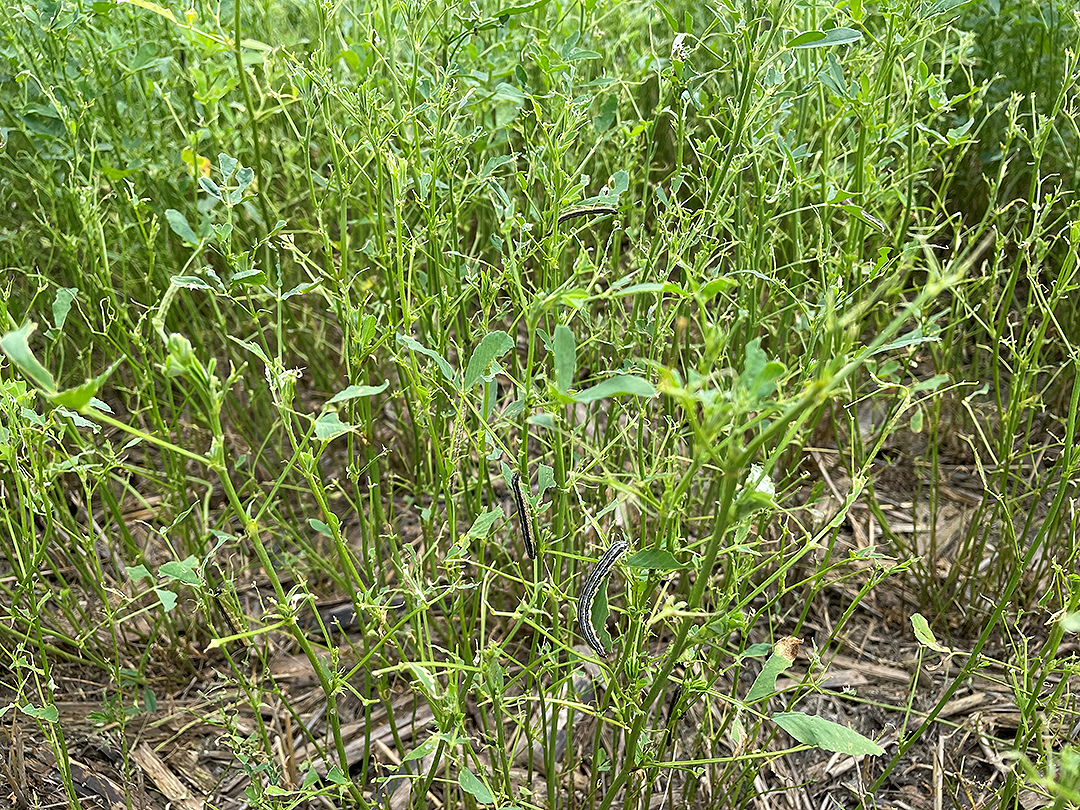
Fall armyworms have been on the increase in alfalfa and pastures recently, so please be scouting as they can decimate a field quickly in the late larval stages. The threshold is 3 or more per square foot and they’re easier to control if the larvae are ¾ inch long or less. When they’re larger than this, they’re more difficult to control and choosing to harvest the alfalfa may be a better control method. Insecticide options include products with active ingredients including the pyrethroids, Alpha-cypermethrin (Fastac CS), Beta-cyfluthrin (Baythroid XL), cyfluthrin (Tombstone), Gamma-cyhalothrin (Proaxis, Declare), Lambda-cyhalothrin (numerous products), permethrin and Zeta-cypermethrin (Mustang Max), organophosphates, chloropyrifos (numerous products), and carbamates, carbaryl (Sevin) and methomyl (Lannate).
JenRees 6/6/21
Grateful for the nice weather last week for post-emergence spraying! As crops continue to rapidly grow, a reminder for proper growth staging using the leaf collar method. A collar develops at the leaf base near the stalk after each leaf fully expands. Think about collars like the collar on a button-down shirt. The collar flares slightly at one’s neck, just as a true exposed leaf collar flares at the base of the leaf at the stem. Start counting leaves at the base of the plant with the smallest rounded-tip leaf with a collar as #1. From there count every leaf with a true collar. Leaves that are still wrapped in the whorl around the main stem without exposed leaf collars are not counted. You can also paint a certain leaf of the plant, such as V5 or V6, inside the field (not endrows), so you can continue to count leaf collars as the lower leaves start to slough off.

It may also be helpful to get irrigation scheduling equipment installed soon. For those with watermark sensors, we’d recommend to soak the sensors in water for 24 hours and then read them to make sure they’re under 10 kilopascals. Then allow them to dry out to 199. Before installing, soak again (but only needs to be like 5 min.), and they should still read less than 10 kpa before installing. Last year I made a video regarding installation if it can help (https://youtu.be/4r5gn2pvvB4). For those looking for telemetry options, there are options available for watermark sensors too. One option from Servi-Tech is called the Profiler through their STEPS program. Another option is from Irrometer who makes watermark sensors. For those who use ET gages, remember to use distilled water when filling the main column, prime the small tube with the stopper and ensure there’s no air bubbles, and remember to fill the ceramic top with water before adding the stopper. With Dr. Suat Irmak’s departure from UNL to Penn State, the ET gage site has been decommissioned. ET information can also be found at UNL’s CropWatch website at: https://cropwatch.unl.edu/et_resources.
Weed Management Field Day: Growers, crop consultants and educators are encouraged to attend Nebraska Extension’s Weed Management Field Day from 9 a.m. to 1 p.m. June 23, 2021 at the South Central Agricultural Laboratory near Clay Center. The field day will include on-site demonstrations of new technology and new herbicides for corn, soybean, sorghum, and sweet corn. An early morning tour will focus on weed management in soybean and sorghum followed by a tour of weed management in field corn and sweet corn. Field experiments will provide information for weed control options with various herbicide programs. Three Certified Crop Advisor (CCA) Continuing Education Units are available in the integrated pest management category. There is no cost to attend the field day, but participants are asked to preregister at http://agronomy.unl.edu/fieldday. The South Central Agricultural Laboratory is five miles west of the intersection of Highways 14 and 6, or 13 miles east of Hastings on Highway 6. GPS coordinates for the field day site are 40.57539, -98.13776.
Bagworms: Have received a few questions regarding if bagworms have emerged yet. The very cold winter hopefully may have impacted bagworm survival since they weren’t as insulated on trees. I haven’t checked trees yet, but here’s a trick to help know. If you have last year’s bags on your trees that are sealed (don’t have an open hole at the top), you can pick off some bags, place them in a ziplock bag, and place it outdoors on the south side of your house. When/if you see larvae emerge, it’s a good indication to start checking your trees in the next weeks. The larvae are really small and hard to see. Stand still and watch the tree. If bagworm larvae are present, you will see very tiny movements as they begin the process of building new bags. I have pictures and a video at: https://jenreesources.com/2015/06/27/bagworms-in-evergreens/. For more info., please see: https://go.unl.edu/rgju.
JenREES 5-31-20
Corn: I really enjoy this stage when corn is just tall enough to give the fields a green cast when looking at them from an angle. There continues to be discussion and questions about uneven corn emergence. Like many, I wasn’t anticipating seeing uneven emergence after having great soil conditions (right moisture and a warming trend of temps) for planting. Variations in soil temp, depth, and moisture can delay germination from a few days or longer. Residue blowing back over the row explained much difference in emergence this year. I wish I would’ve noted the days on my calendar, but there’s a couple warm days in late April during planting where it just seemed like the moisture rapidly left the soil surface. And, in conversations it seems as if others noticed that too. So I think moisture around seed was another factor as was fertilizer burn in some situations. Purdue University has some research which showed yield reductions of 6-9% for plants emerging 1.5 weeks later than a uniformly emerging stand. They also found yields of uneven stands to be similar to planting the stand 1.5 weeks later.
If you’re side-dressing nitrogen and interested in testing different rates, we have some on-farm research protocols available at: https://go.unl.edu/tv63.
With warmer temperatures anticipated, corn will grow rapidly. This week we wrote an  article in CropWatch regarding proper growth staging of plants; this will be extra critical once we hit V6+. Remember to use the leaf collar method and this is how I explain it. A collar develops at the leaf base near the stalk after each leaf fully expands. Think about collars like the collar on a button-down shirt. The collar flares slightly at one’s neck, just as a true exposed leaf collar flares at the base of the leaf at the stem. Start counting leaves at the base of the plant with the smallest rounded-tip leaf with a collar as #1. From there count every leaf with a true collar. Leaves that are still wrapped in the whorl around the main stem without exposed leaf collars are not counted. I recommend taking a picture inside the end rows to document the growth stage of your field prior to the post-application of herbicide. Next week I will share my experiences with proper growth staging to avoid ear abnormalities. Also be aware of potential off-target movement with dicamba products and higher temperatures.
Soybean: In most cases, soybeans are looking really good. There have been situations this week with herbicide damage to beans that may have been cracking when irrigation or rainfall event occurred allowing some pre-emergent herbicide to enter the row. Pre- herbicides can also rain splash onto cotyledons and first leaves making them look bad, but usually doesn’t kill them unless the weather stays cold and wet. If the plants end up severely pinched below the cotyledons, they won’t survive. Otherwise, keep watching them as they may continue to grow (warm weather will allow them to grow and metabolize the chemical better). I think we’re also possibly seeing some environmental effects from the cold conditions that occurred after planting/emergence when we can’t always explain the appearance of injury on the plant by herbicide. The ‘halo’ effect of ILeVo is another thing that is being mistaken as herbicide and/or environmental injury but it doesn’t last past the cotyledon stage.
Coronavirus Food Assistance Program for Crop Producers Webinar: There will be a webinar on June 4th at Noon (CST) to learn more. Registration is required at the following site: https://go.unl.edu/wj0e. In the meantime, Dr. Brad Lubben has put together an article with more information at: https://go.unl.edu/h3aq. All webinars are also archived at that same web link.
Irrigation Scheduling Equipment: It’s also a great time to get irrigation scheduling equipment installed! I decided to make a quick video instead of writing; it can be found at: https://youtu.be/4r5gn2pvvB4.

Sensors prepped and ready for 2020 on-farm research projects!
Gardeners: For all of you gardening for the first time, congrats! Some tips: keep soil moisture even by ensuring plants have around 1” of water/week (Best to water at base of plant; if use sprinkler, do so in early morning). Mulching gardens with leaves, grass clippings, straw, newspapers aids in conserving moisture, reducing weeds, and maintaining stable soil temperature. If herbicides were added to grass clippings, make sure to read the label for if/when they can be applied to a garden. In general, many labels will say grass clippings are safe after 4 mowings.
JenREES 6-9-19
Crop Updates: It’s been interesting seeing growers sharing pics comparing crops on the same dates in 2018 to 2019. They are behind in many cases compared to last year. Yet, we can be thankful for every field that we’ve been able to plant in Nebraska this year! Weed control is something on many minds right now. On corn, please be sure to count collars to determine growth stages. First leaves are sloughing off on V5-V7 plants right now, so slitting open stalks to aid in counting collars is important as we think of herbicide applications. Bob Nielsen from Purdue has a nice recent article with photos to help you with this: http://www.kingcorn.org/news/timeless/VStageMethods.html. When it comes to beans, I’m concerned how much longer the PRE’s will hold. I share this every year in pesticide training to have the POST with residual on a week before you think you need it, even if you don’t see weeds in the field yet. So assess each field as to when your PRE went on, current weed emergence, and plan on your POST a week earlier to overlap when your PRE residual should be running out. Also, with palmer amaranth on people’s minds, consider attending a glyphosate resistant palmer amaranth field day July 10th near Carleton, NE. Dr. Jason Norsworthy from the University of Arkansas will be the featured speaker. For those who’ve heard me speak on palmer or at my pesticide trainings, much of what I share has been what I’ve learned from his presentations and research papers. You can learn more and register at: http://agronomy.unl.edu/palmer. Adding a small grain and diversifying our cropping systems is one way to aid in palmer/waterhemp management. There are several upcoming wheat and pulse crop field days occurring throughout Nebraska in the next two weeks and you can read more about them at: https://go.unl.edu/b65e.
At some point, irrigation may be needed again. Installing irrigation scheduling  equipment now allows you to watch your soil moisture profile as your crops grow, gain better confidence in your readings, and it’s just easier to install them at earlier growth stages when there’s moisture in the profile. Here’s some tips for those using watermark sensors. (As I walk through this, I’m using kilopascals (kpa) for the sensor readings but the same numbers apply to centibars (cb)). First, be sure to prime the sensors to ensure they’re working correctly. Do this by soaking the sensors for at least 24 hours in water. If you still have mud on the sensors, gently remove with your fingers, not with a brush. Then check the readings to ensure they read 10 or less. If they don’t, I allow them to soak another 24 hours and recheck; replace any that don’t read 10 kpa or less. Allow the sensors to dry out to 199 kpa again by setting out in the sun/wind/blowing fans. (Note that water will move into the PVC tube during soaking, so you’ll need to remove the cap and dump the water out if you don’t have a hole drilled at the bottom of the PVC tube. This is also true during the installation process.) When you’re ready to install the sensors, they need to be soaked again, but it should only take them 1-5 minutes to read 10 kpa or less prior to installation. There’s a couple things I’ve learned with installations that help me. First, use an ag consultant’s tube on soil probe to dig the foot wherever the sensor is installed. This allows for a better fit with no air gaps along the sensor. I use a regular soil tube to dig the hole the foot/feet above that to aid in pushing the sensors. In wet, clayey soils, it can be difficult to push the PVC pipe into the ground, so digging the upper holes with a bigger tube helps me with that. The other thing I do is carry my bucket with water for the sensors to the field with me with the sensors. To aid with pushing the sensors in the ground, I wet the PVC tube with water from the bucket prior to installing it. NEVER pour water into the holes and don’t make a slurry mix. I’m hearing several were taught to do this, but it’s not what Nebraska Extension teaches based on Dr. Suat Irmak’s research as it will change the soil moisture of the holes compared to the surrounding soils. Make sure the sensors hit the bottom of the hole and fill in soil where the PVC pipe meets the soil line. Suat shared how he used rubber washers around the top of the PVC pipe at the soil line to aid in water not running down the PVC tube when soil cracks at the surface. For those installing ET gages, a reminder to remove the stopper from the ceramic top and fill the ceramic top with distilled water in addition to the main tube of the ET gage. I fill the ceramic top, allow it to soak into the ceramic plate a little and refill it. Then prime the inner tube with stopper ensuring there’s no air bubbles in the small tube after placing it into the ceramic top. You can also double check for air bubbles by gently removing the glass site gage (by pressing down on the rubber tubing at the base of the site gage), allowing some water to cycle through, and then replacing it.
Maple seedlings: Maple trees have now leafed out and the rain has allowed the abundance of seeds to produce seedlings in people’s lawns and gardens. I know they look bad because they do at my place too. Mowing is the best way to take care of them in your lawn and it will take several mowings to do so. Don’t lower your mowing height as you want to maintain a healthy grass canopy. Eventually the seedlings will continue to grow to where the mower blade cuts off below the growing point and the seedlings will die. In the flower beds, they are very easy to pull right now. It takes some extra time, but that’s the best way to rid them there.


JenREES 6-17-18
This past week contained many off-target herbicide concern calls. Prior to Memorial Day I had made a note that post-herbicide applications to corn began in much of the area and anticipated phone calls to begin in about two weeks. Most of the conversations this week were more FYI to let me know they had soybean leaf cupping.
Here’s a few things to consider if you are having soybean leaf cupping.
- First, was a post-herbicide application made to your soybeans? If so, check for any potential tank contamination (Check out this CropWatch article: https://go.unl.edu/fnig). If not, check out this publication (http://ipcm.wisc.edu/download/pubsPM/dicamba2004.pdf) to determine if any of the criteria mentioned could possibly be contributing to the problem.
- Determine how old the plant is by asking when the soybean was planted and even better when it emerged. A soybean plant will produce a new node every 3.75 days.
- To determine the timing of damage, I count the total number of nodes on the plant to the last trifoliolate where leaf edges are not touching. The total number of nodes may differ in different parts of the field such as irrigated and non-irrigated especially after herbicide damage and drought-stress (Example 8 nodes irrigated and 6 non-irrigated). Take the number of nodes X 3.75 to get total approximation of plant age. Then count back on the calendar to determine approximate emergence date. If I use 8 nodes in this example X 3.75 = around 30 days ago the plant emerged.
- I then count the number of nodes to the very first damage I see on leaves (Example 3). Multiply this number of nodes times 3.75 and count forward on the calendar from emergence to that date. For instance, in this case, damage occurred around 11 days after emergence.
- I also like to count how many completely unfurled trifoliolates are affected (Example 6 trifoliolates). Take that number and multiply by 3.75 (Example 6 X 3.75= approximately 23 days ago the damage occurred).
- In this example, it worked to count either direction (from emergence and from current date) to determine approximate timing of off-target movement occurring. In all the situations I’ve looked at thus far, the timing goes back to around Memorial Day with post-dicamba herbicide applications applied to corn.
- Auxin-like herbicides affect only cell division. Thus, fully developed leaves (no longer expanding via cell division) are not affected even though they may be expanding by leaf cell enlargement. Only the tips of the newest exposed soybean leaves may experience damage to dicamba as they are still undergoing cell division. Otherwise, it can take 7-14 days for leaf damage from dicamba injury to appear on susceptible plants and damage will occur typically 4-6 nodes. This is because dicamba is also translocated once inside leaf cells. Thus it impacts cell division of the leaf primordia at the stem apex. We may not even see those leaves yet because they are still enclosed in the stem apex tissue.
- In a matter of weeks, affected fields can go from appearing to have minor damage, to looking really bad, to growing out of damage. It looks worst when those affected nodes push upward giving the field a grayish/white cast to it as the leaves become much reduced in size and are tightly cupped. Eventually the leaves will begin to look more normal again in time (as long as a second off-target movement doesn’t occur).
What can you do? Water via irrigation and/or rainfall is the best recovery tool for dicamba damage. Waiting is another. We’re blessed to grow indeterminate soybean in Nebraska which continues to produce nodes and leaves upon flowering which allows our soybean to grow out of damage.
- Wait till harvest to determine any yield impacts if there are areas impacted vs. those which aren’t. Otherwise, field-scale damage is difficult to discern yield impacts.
- You can talk with your neighbors/ag retailers regarding what they sprayed. In our area of the State, it’s often difficult to pinpoint the source of off-target movement with so many applying dicamba products to corn for palmer control often around the same time-frame. Now that post-apps to soybean are also occurring, that may also become a challenge. Of all the fields I visited last year, less than a handful of farmers sought any sort of compensation and those were more often due to tank contamination issues. If you wish to pursue that route, you need to file a complaint with the Nebraska Department of Ag.
- For future dicamba applications, check out these best management tips: https://go.unl.edu/97ok.
- For those of you reading this in a source outside of my blog, I created a video to hopefully be more visual and clear on understanding this method of diagnosing timing. You can check it out at my YouTube site: https://www.youtube.com/user/jenreesources.
Bagworms: It’s June and one of my top questions has been “Have I found bagworms yet?” Well, they’re now feeding and forming new bags on junipers and spruces. What you’re looking for are not the old bags at this point, but very small (fingernail size) new bags that move as the caterpillar is feeding and making the larger bag. This video from Backyard Farmer (https://youtu.be/05A2quj9nO4) does a great job of showing various stages of bagworms and sharing on control methods. Check it out!
Irrigation Scheduling Workshops: Steve Melvin, Extension Educator in Hamilton/Merrick Counties asked I share about upcoming irrigation workshops hosted by UNL and Upper Big Blue NRD. The program will focus on installing the equipment and making irrigation scheduling decisions using the data generated by Watermark sensors. The workshops will be held from Noon-1:30 p.m. on June 25th at the Corner Café, 221 Main St in Stromsburg and also at the same time June 28th at the Hordville Community Building, 110 Main St. The Upper Big Blue NRD will provide the lunch. The first presentation will be Installation of Watermark Sensors and Data Logger presented by Dan Leininger, Water Conservationist with the Upper Big Blue NRD. The second will be Deciding When and How Much Water to Apply Using Watermark Sensor Readings presented by Steve Melvin. The irrigation scheduling strategies presented in Steve’s presentation can be used with any soil water monitoring equipment data. More information is available by calling Steve Melvin at (308) 946-3843 or visiting https://extension.unl.edu/statewide/merrick/.
JenREES 6-10-18
Thank you to Tena with Faller Landscape in York and to all the youth who participated in our 4-H landscape design workshop and helped plant the Nebraska area! It will hopefully be beautiful for fair!
Crop Update: Rain continues to be spotty and windstorms have resulted in various levels of greensnap in some fields. Overall crops are growing and getting a decent canopy. It’s been interesting watching the radar on weather apps as so often they look like precipitation should be occurring yet that’s not always the case. Grateful for all of you who share crop updates-including things such as impacts on hay crops, pastures, etc. and for our farmers working with me on soil moisture monitoring. I was told this past week of the impact of our groundtruthing on the drought monitor; radar would make it appear we’re not as dry as we truly are. So just wanted to share that with you-that your input is important as we then share that input with those who work with the models and maps! I plan to get soil moisture sensors installed in non-irrigated fields in York, Seward, and Clay this week as well.
Soil Moisture Sensors Tips: With cultivating and hilling progressing, some are now looking at getting soil moisture sensors installed. If you utilize watermark sensors, the following are some tips I’ve learned.
Test sensors with wet/dry process to remove all air bubbles:

- First, make sure sensors read 199.
- Then, soak sensors for at least 24 hours. They should read 10 or less (Jenny’s note-I realize they may read this in a matter of minutes to hours but it’s our best practice recommendation to ensure all air bubbles are removed).
- If they don’t read 10 or less, gently rub any soil loose on them with your fingers (don’t use a brush) and allow to continue soaking for another 24-48 hours. If they still don’t read under 10, I don’t use them.
- Best practice is to then allow the sensors to completely dry out again to 199 to complete the wet/dry process. (Jenny’s note: I realize, due to time constraints, many sensors get installed once they have been soaking and never go through the complete drying process).
Installation:
- Avoid installing sensors in saturated soil conditions in clayey soils. Doing so allows a thin clay film to develop on the sensors which then affects readings .
- Prior to installation, the sensors should be soaked again and installed wet. The soaking process only takes a matter of minutes to get back to 10 or below. I carry the water bucket with sensors with me into the field.
- When soaking, water moves into the PVC pipe, thus it can take time for the water to drain providing accurate readings if not removed. Some sensors have a hole drilled in the PVC pipe above the sensor to allow water to drain. Otherwise, it’s important to remove the caps and tip the sensors over to dump any water that has accumulated in the PVC pipe during the soaking process. I then put the cap back on, take my hand and wet the PVC pipe with water so it pushes in easier. Some like to use WD-40 but my concern with that is it getting on the sensor affecting readings.
- Install all sensors where the sensor itself sets using an ag consultant tube (can be 12 or 18 inches). An ag consultant tube has a slightly smaller diameter that provides a tight fit for the sensor. Use a regular soil probe for the foot above that. For example, for 1’ sensor, I use ag consultant tube. For 2’ sensor, I use regular probe for first foot and ag consultant tube for second foot. For 3’ sensor, I use regular probe for first 2 feet and ag consultant tube for third foot. The reason for this is in clayey soils that are wet, there’s greater resistance to pushing in that sensor, so this is one way I’ve found which is easier for someone like me to push them in. (Jenny’s note: many have installed sensors with a regular soil probe through the years and that’s also fine. Just know that you may see more water run along side of tube before soil makes a tight fit around where sensor is located. I’ve just found less issues with this when I use the process described above).
- NEVER pour water into the hole or make a slurry. Make sure the sensor hits the bottom of the hole as air gaps can make the sensor readings inaccurate. Some people find it better to not remove the entire amount of soil for a specific depth and then push the sensor the rest of the way till the correct depth is obtained. I’m not always strong enough to do that so do what works for you as long as the sensor is at the correct depth and there’s no air gaps.
After Installation:
- Make sure to fill in any gaps around the sensor with soil and make sure there’s no soil cracks around the sensors.
- Make sure to mark each sensor and flag them well.
- Sensor readings should equilibrate with the soil within 48-72 hours but especially within a week.
- If a sensor starts reading really dry, before replacing it, I often remove it and reprime it in the field. This can be done by re-soaking in water for 1 minute or so till it goes back below 10 and then reinstalling in same hole. If it doesn’t go below 10, I replace it. If it reads strange the next week, I also replace it.
ET gages:
- A reminder to use distilled water in the tube and to fill the ceramic top when you’re also filling the main tube. I usually fill the ceramic top and wait for it to soak up a little then fill again.
- Prime the ET gage ensuring no air bubbles are in the second tube with the stopper. I always overfill the ET gage to help with priming and ensuring there’s no air bubbles.
- Excess water can be removed and also air bubbles can be removed by gently pulling down on the glass site gauge tube at the rubber base and releasing extra water from it. Air bubbles can also be released in this process. Place the site gauge tube back in place when you are at a water level between ‘0 and 1’. Then place one red marker ring on that beginning start level.
- I always plan to refill the ET gage when it gets down to ‘9’ on the site tube.
- The green canvas cover should be replaced at least every 2 years and be sure to dust it off and the white membrane below it.
In another column I’ll share how to use the two tools together for irrigation scheduling. All videos and charts with more information can be found at: https://water.unl.edu/category/nawmn. This is a checklist I made awhile back with Daryl Andersen which has more detail and could honestly be updated: http://www.littlebluenrd.org/pdf’s/forms/etgage_sensor_checklist.pdf but may also be helpful.
Tree Damage: Recent windstorms have caused for many downed branches and even some trees. When removing broken branches or dead branches, it’s important to prune correctly for tree health. Correct pruning of larger branches can often involve 3 cuts per limb. The first two cuts are made away from the trunk of the tree to remove most of the weight of the limb. The third cut is near the trunk itself at the bark collar ridge where the tree will eventually seek to heal. I like this Backyard Farmer YouTube video as a good visual of correct pruning: https://youtu.be/9cl0Qxm7npk. Pruning is best done in the dormant season of February and March. It’s best avoided in April and May when trees are putting energy into new leaves and in the fall as fall pruning can result in growth instead of the tree preparing for and going into dormancy. Some great resources with more information on proper pruning are: https://go.unl.edu/v9uf, https://go.unl.edu/gdb9, and this blog post https://jenreesources.com/2014/04/20/proper-tree-pruning.
Long-Term Irrigation Water Requirements for Corn in the Little Blue Natural Resources District Counties
Irmak S-Newsletter Article LBNRD-Final (PDF version of this article)
Authored by:
Suat Irmak
University of Nebraska–Lincoln
239 L. W. Chase Hall, P.O. Box 830726, Lincoln, NE 68583-0726
E-mail: sirmak2@unl.edu Ph: (402) 472-4865
http://engineering.unl.edu/bse/faculty/suat-irmak-0/|
(Author’s note) The scientific and research-based data and their interpretation presented in this article is intended solely for informational purposes and should not be interpreted otherwise in any shape or form. As a University faculty member, the author cannot and will not take sides with respect to water resources allocation decisions. Thus, the author is not for or against any potential water allocation. The author sees his role as an unbiased university faculty member is to share information and data with all people we serve to aid in making better-informed decisions. The following information was presented to the Little Blue Natural Resources District Board by the author on December 6, 2016.
Water allocations may occur in areas where long- or short-term rate of depletion of water resources exceeds water availability. Availability (decline or increase) of water resources can be impacted by numerous natural and human factors, including:
- Overpumping of surface and/or groundwater resources due to suboptimal irrigation management that result in over-irrigation [optimal irrigation management is considered as using one of the or a combination of the technologies available (soil-based, climate-based, or plant-based) to determine the proper irrigation timing and amount to meet crop water requirements for optimum crop growth and yield],
- Change in climatic variables, including air temperature, precipitation, solar radiation, wind speed, vapor pressure deficit,
- Soil physical properties,
- Potential changes in crop water use as a result of changes in climatic and other hydrologic variables,
- Changes in growing season length,
- Cropping patterns, including changes in crop hybrids, varieties, and cultivars, and switching from agricultural lands to natural land use (e.g., grasslands) and vice versa,
- Irrigation methods used as well as irrigation management practiced,
- Soil and crop management practices,
- Geologic conditions, including elevation,
- Other factors.
Thus, when water allocation programs are planned, the aforementioned factors should be taken into account to develop and implement a reasonable, but effective, allocation program. Discussions have been occurring in the Little Blue Natural Resources District (LBNRD) in terms of potential water allocations. In this article, long-term (30 years) data are presented to evaluate the impact(s) of various water allocation amounts in terms of meeting (or not meeting) crop water requirements for one of the major agronomic row crops produced in the district (corn). The counties considered in the analyses are: Adams, Clay, Jefferson, Thayer, Webster, Nuckolls, and Fillmore. Dr. Irmak has been conducting numerous scientific research projects in this part of the state for corn, soybean, sorghum, winter wheat, sweet corn, seed corn, and other cropping systems since 2003. Some of the major research topics include, but are not limited to: soil-water resources and irrigation engineering; crop water use efficiency; variable rate irrigation and fertigation; agricultural water management and conservation; measurement and modeling of surface energy balance, evapotranspiration, transpiration, evaporation and water productivity of agro-ecosystems; spatio-temporal plant water extraction; agro-meteorology; impact of change in climate variables on water resources and agro-ecosystem productivity; impact of tillage practices on water and energy balance; cover crop impact on soil quality and water and energy balance; measurement and modeling of soil moisture dynamics and soil physical properties.
Using long-term climate and crop water production functions that have been measured in Dr. Irmak’s research fields, crop water requirements were calculated for each growing season from 1986 to 2015 for corn. Detailed procedures are presented in refereed scientific journal articles published by Dr. Irmak and his research team and all these scientific publications are available.
Precipitation Trends
One of the critical variables that impact water availability and water balance components in any given area is precipitation. The growing season total precipitation amounts from 1986 to 2015 for seven counties are presented in Figure 1. While it varies with various factors, the growing season in this article was assumed to be from planting in May 1 to physiological maturity in September 30. The growing season precipitation has a fluctuating trend, but overall, there are declining trends in all counties. The magnitude of decline in precipitation exhibited substantial variation between the counties. The growing season precipitation has declined by 5.58, 6.41, 1.21, 2.68, 4.51, 4.45, and 1.73 inches in Adams, Clay, Jefferson, Thayer, Webster, Nuckolls, and Fillmore County, respectively, from 1986 to 2015. When the average of all counties is considered, the LBNRD has been receiving 3.79 inches of less precipitation in recent years than it did in mid-1980s and early 1990s, which can considerably impact water availability in the area and these changes in precipitation trends as well as magnitudes can substantially impact water balance analyses. It should be noted that the aforementioned magnitudes of trends are calculated from 1986 to 2015 and if a different period was used, the magnitudes and trends may change. However, the important point in Figure 1 is the significant overall decline in precipitation over time.
Gross Irrigation Requirements for Corn
Gross irrigation requirement (GIR) is defined as the amount of water required to be pumped to meet the net crop water requirement in the field. Not all pumped water can make it to the crop root zone due to losses during the water transport and application process. Since some amount of water is lost during this process due to conveyance, distribution, field application, evaporation, canopy interception, leaks, etc. additional amount of water is needed to be pumped to ensure adequate net irrigation requirement in the crop root zone is met. The net irrigation requirement (NIR) is the amount of water that is actually needed in the crop root zone to meet crops’ evaporative demand (evapotranspiration) to maintain adequate growth and development for optimum yield production. The amount of water that needs to be pumped to achieve net irrigation requirement is a function of the efficiency of the irrigation system used and other factors. By definition, the NIR does not include losses that may occur during the transport, distribution, and application of water in the field as opposed to gross irrigation water requirement. Thus, the NIR needs to be adjusted with the irrigation system’s efficiency. It should be noted each irrigation system has a different irrigation efficiency value and this value is not constant, rather it is dynamic and change over time, even in the same growing season as a function of numerous factors, including climatic factors and canopy development. For example, not all center pivots have the same or similar irrigation efficiency value and the values can change significantly depending on numerous factors, including how any given system is managed (in addition to climatic conditions and canopy development). Thus, using accurate irrigation system efficiency value is important for accurate quantification of GIR.
Annual gross irrigation requirements (GIR) of corn for all counties for each year are presented in Figure 2. As expected, GIR varied substantially from year to year as a function of numerous factors that influence crop water use, primarily climatic variables, including precipitation. These GIR values were determined for a healthy center pivot-irrigated corn crop that is actively growing and transpiring water vapor and result in very good grain yield (e.g., 230-250 bu/ac). The GIR values were adjusted by the irrigation efficiency of the center pivot, which is assumed to be 85%. It should be noted that the irrigation efficiency of a center pivot system is not a constant value, and can significantly change with numerous factors, including pivot operation conditions, maintenance, crop growth stage, crop management, and other factors. Thus, even for the same center pivot system, the efficiency value can change over time within the same growing season. Even a well maintained center pivot can have very low irrigation efficiency, depending on the conditions in which the irrigation application is practiced. This is valid for all other irrigation systems, but with different irrigation efficiency values.
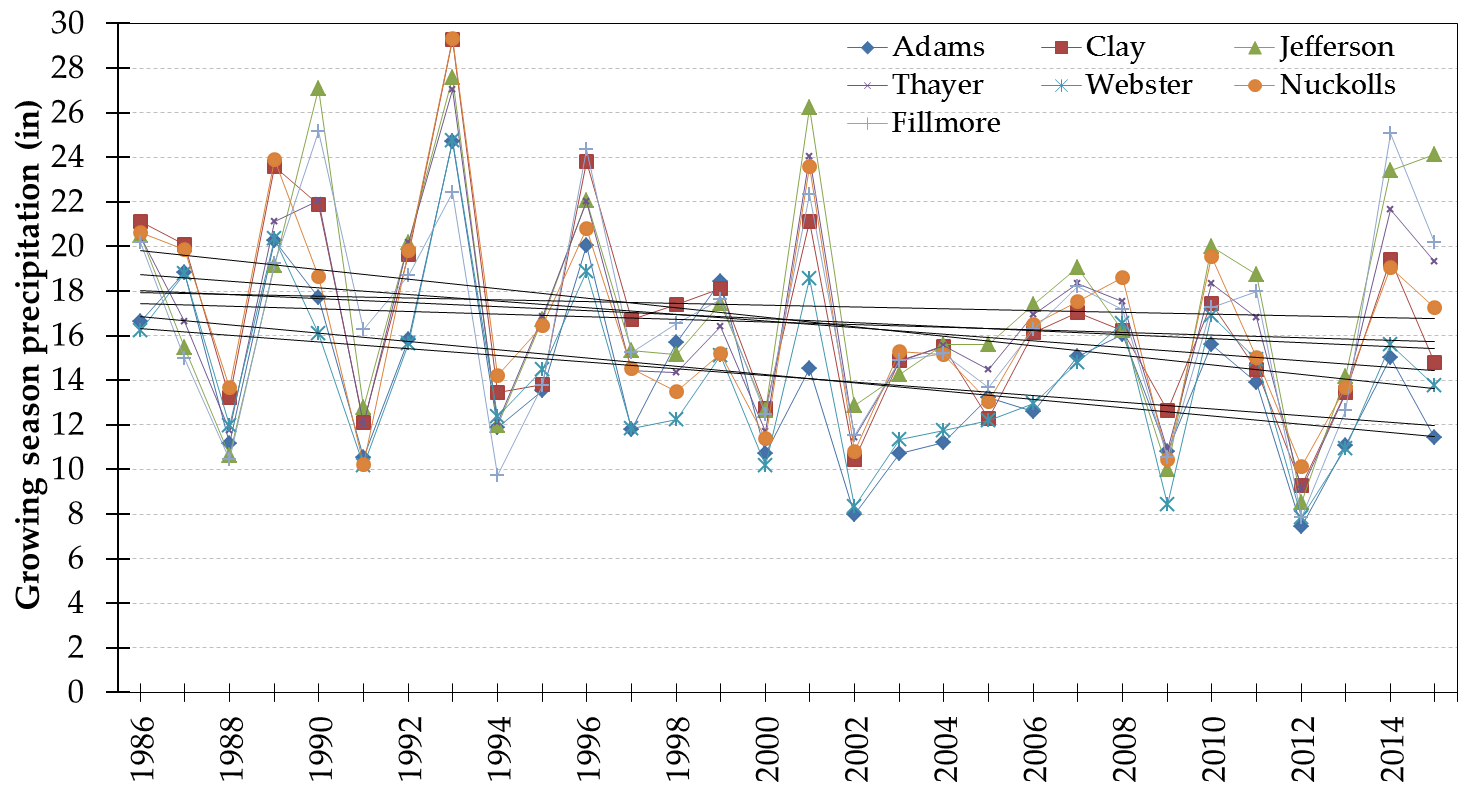
Figure 1. Temporal (1986-2015) distribution of growing season precipitation in seven counties in the LBNRD.
The GIR for corn ranged from zero in all counties in 1993 (which was one of the wettest years in Nebraska) to as high as 26.9 inch in 2002 in Webster County (Figure 2e). The GIR values were also very high for all counties in 2012 (about 26 inches). Figure 2 is an example of inter-annual variation in irrigation requirements in that it is different every year. Thus, using an average value for GIR or water allocation programs may not provide a detailed picture of this variation.
For much more effective determinations of adequate GIR for a given county, the standard deviations of the GIR values should be considered. Standard deviation values represent the amount of difference from the mean (average) value. The standard deviation values of long-term average corn GIR for each county is presented in Figure 3. As Figure 3 clearly shows, the long-term average GIR values have very large standard deviations that should be taken into account. The standard deviation of long-term average corn GIR ranged from 5.9 inches in Adams County to as high as 7 inches in Jefferson County with a seven county average value of 6.6 inches. The interpretation of the standard deviation values should also be done very carefully, because it will considerably impact the crop productivity response to an average allocation amount. For example, in Jefferson County, in a given year, the long-term average corn GIR can be as much as 7 inches above the long-term average GIR value, depending on the climatic and other conditions. If this happens in a given year, the crop production and associated farm net income would be significantly jeopardized when the water allocation is determined based on the long-term average value. While it is used in practice very often, when natural systems are considered, there is no such term as “normal” as every year is different when various climatic variables are considered. However, determining the standard deviations and especially determining the allocation amounts based on the standard deviations for multiple counties that have spatial attributes is an extremely difficult task. Therefore, in many applications, long-term values are used instead, perhaps for simplification.
Different Water Allocation Amounts and Meeting the Corn Irrigation Requirements
Different hypothetical amount of water allocation amounts and what percent of the time these amounts are not able to meet corn crop’s GIR in each county are presented in Table 1. In Table 1, the allocation amounts were varied from 7 to 12 inches and the number of years and the percentage (with respect to total number of years from 1986 to 2015, which is 30) when the allocation amount was not able to meet corn GIR were determined. The interpretation of Table is rather very simple. For example, a 7-inch of water allocation was below corn GIR in 17, 17, 14, 17, 22, 21, and 12 years out of 30 years in Adams, Clay, Jefferson, Thayer, Webster, Nuckolls, and Fillmore Counties, respectively. In terms of percentage, a 7-inch water allocation was not enough to meet corn GIR at 56.7, 56.7, 46.7, 56.7, 73.3, 70, and 40% of the time in Adams, Clay, Jefferson, Thayer, Webster, Nuckolls, and Fillmore Counties, respectively. The impact of other allocation amounts (8, 9, 10, 11, and 12 inches) on meeting (or not meeting) corn GIR can be interpreted in the same way in Table 1.
Table 1. Percent of time when different water allocation amounts would not meet corn gross irrigation requirement (GIR).

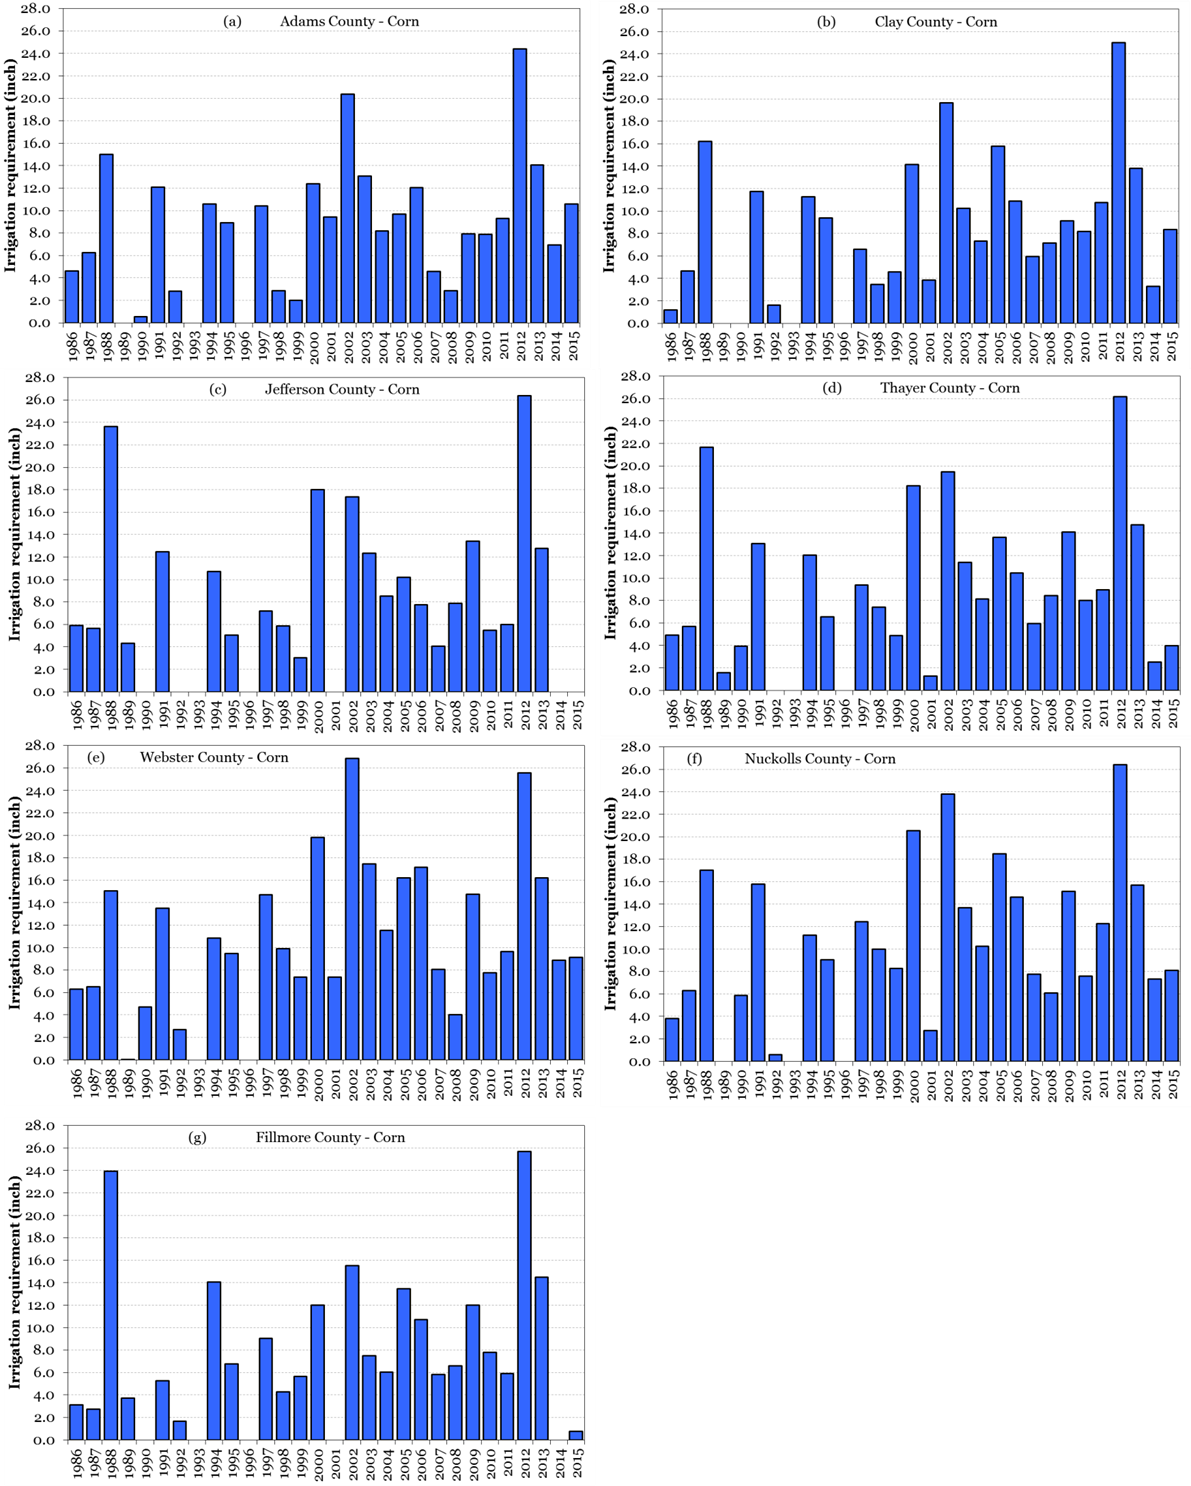
Figure 2. Temporal distribution of corn gross irrigation requirements (GIR) in seven counties in the LBNRD from 1986 to 2015.

Figure 3. Standard deviation (inch) of gross irrigation requirement (GIR) for corn in seven LBNRD counties. The standard deviation values were calculated for the period from 1986 to 2015.
It is important to note that the analyses for potential impact(s) of various hypothetical water allocation amounts on meeting (or not meeting) corn irrigation water requirement to produce good yields (e.g., 230-250 bu/ac) were carried out for the period from 1986 to 2015 for specific counties in the LBNRD. Analyses, data, and interpretations should not be extrapolated beyond these boundaries.
Information and data provided above are solely for information and education purposes. The author does not take any sides or provide any opinion as to whether allocation should be imposed or not. If the decision is made to go forward with the allocation, some of the most effective water allocation programs are those that incorporate research-based educational and outreach aspects of water management and university can offer technical and scientific aid to growers and others who are involved in crop production and irrigation practices to make the best use of the allocated amount of water resources for optimum crop production. This includes implementation of technology to counter some of the potential negative impact(s) of limited water resources for optimum crop production. There are numerous proven, effective irrigation management strategies, tools, and methods developed at UNL that result in enhanced crop water productivity. This can be achieved by reducing or eliminating over-irrigation and conserving water resources through reducing unnecessary water withdrawal for irrigation. For some of these resources, readers are encouraged to visit the Nebraska Agricultural Water Management Network (NAWMN) website at http://water.unl.edu/cropswater/nawmn. Some of the publications that are related to irrigation science and engineering, evapotranspiration of various cropping systems in each of the NE counties, water management technologies, climate impact(s) on agricultural productivity, and related topics are also listed in Dr. Irmak’s website at https://engineering.unl.edu/bse/faculty/suat-irmak-0/.
Nebraska Ag Water Management Network Conference
March 10th marks the third annual Nebraska Ag Water Management Network Conference with 2016 being the 11th year since the Network was formed! If you’re interested in learning how you can better schedule your irrigation in addition to learning about the latest in irrigation research from Nebraska Extension, consider attending this free event!

2015 Nebraska Ag Water Mgmt Network Meeting

April 2, 2015 is the date for the 2nd annual Nebraska Ag Water Management Network (NAWMN) Meeting! Come hear the latest in irrigation research and share with your peers during the innovation sharing and Q/A discussions. There’s no charge but please RSVP to Gary Zoubek at (402) 362-5508 or gary.zoubek@unl.edu.

