Beginning Soil Moisture 4-26-18
Some rains helped with the top foot profile at some of these locations last week. One thing to keep in mind when viewing these graphs is we don’t always know what’s going on below the soil surface. One farmer had a good point regarding my “blips in the graphs” in my last blog post. I mentioned they could be due to a soil crack along the PVC pipe-which we do see occur and can be true. However, he also had a good point that it could be a worm hole, root channel, etc. that water may have followed for a brief time period, which could also be true, especially in these long-term no-till fields. As you look at the charts this week, it’s important to keep in mind that soil water also moves via gravity (termed ‘gravitational water’). Thus, sometimes why we can see changes in soil moisture in the successive drier layer with small amounts of precipitation.

Nebraska Drought Monitor as of 4/26/18 showing increasing ‘abnormally dry’ areas of the State. The ‘moderate drought’ area has expanded further into Webster and Thayer counties. Stars show locations where I’m taking pre-plant soil moisture status.
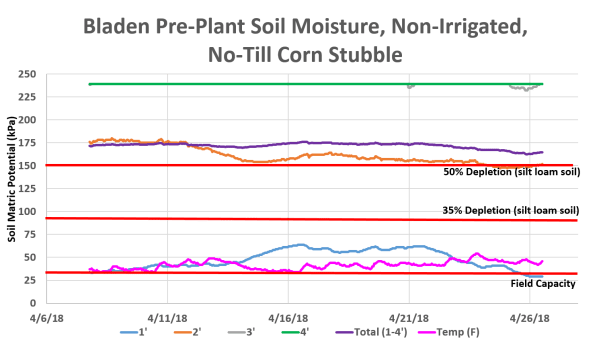
Beginning soil moisture at Bladen remained relatively unchanged last week. The top foot went back to around field capacity with some rain events. Total soil moisture depletion is above 50% at this site as are all soil layers from 2′-4′).
Moisture last week did appear to re-wet the top 2 feet. I even probed the soil in the same area to ensure there was truly moisture in the second foot, which there was. Yet as you can see from the graph, the second foot was starting to climb when I took these readings. My guess is without additional precip, the second foot will be above field capacity again next week.
Because the top two feet were already around field capacity, gravitational water along with moisture received last week may have created the dip in the third foot readings seen over a few days. It was rising back up to above 50% completion on 4/26. The sensors were removed on 4/26 as the field was planted to soybean that day.

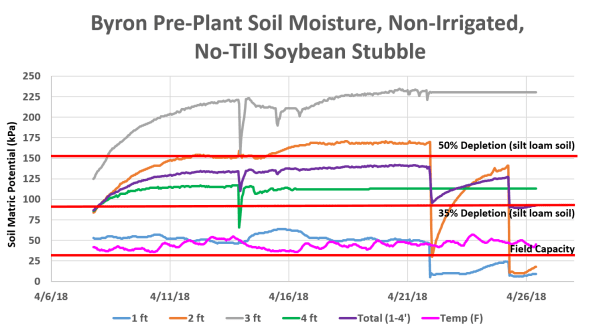
This location received 0.20″ of rain last week with essentially no change in soil moisture status from the previous week. Total soil moisture (1-4′) is steady around 35% depletion.
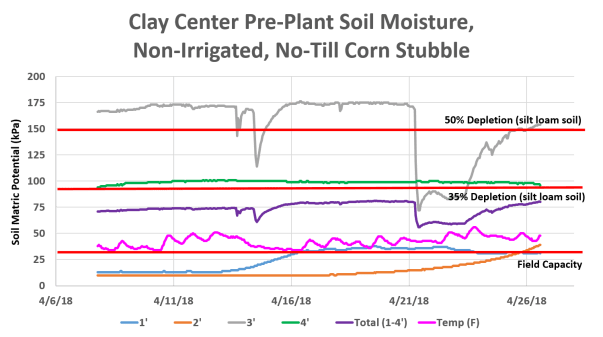
This location also received around 0.20″ of rain last week. Something happened to create a short in the top foot sensor, thus, the lack of data for 1′ and total (1-3′) after 4/22. It was fixed on 4/26.

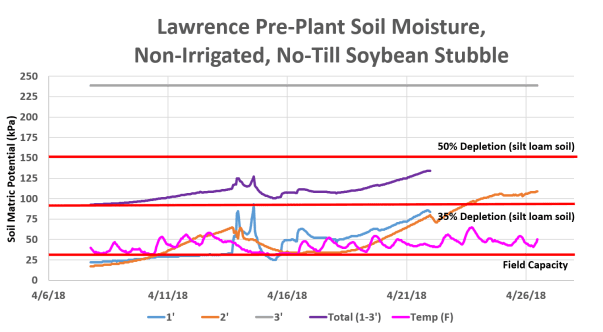
This location received around 0.60″ of rain last week. The top foot remained steady and there was a gradual decrease followed by increase in soil moisture in the second foot. This would make sense from the combination of gravitational water and the precipitation moving through the first foot into the second, but the moisture wasn’t enough to maintain the second foot at a wetter moisture level.
Posted on April 30, 2018, in Soil Moisture and tagged beginning soil moisture, drought, pre-plant soil moisture. Bookmark the permalink. Leave a comment.


Leave a comment
Comments 0