Soil Moisture 5-23-18
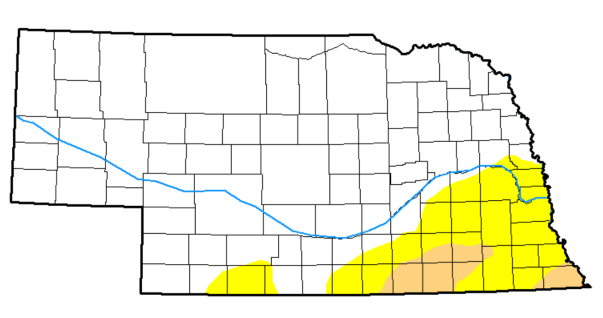
Drought monitor as of 5/22/18: The tan area of moderate drought increased to 3.67% (from 1.88 a week ago) this week while the yellow abnormally dry area decreased to 18.34% (from 22.57% a week ago).
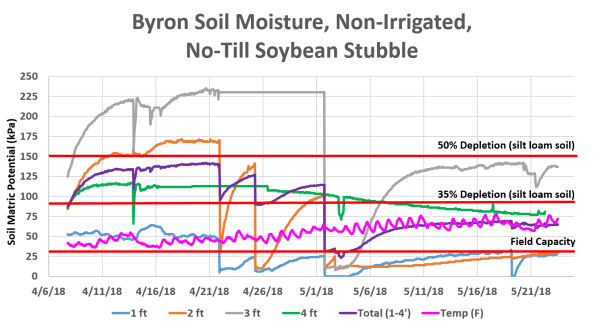
The Byron area received around 0.28″ which allowed for a brief drop in the first foot sensor but didn’t stay there. Both the first and second foot are around field capacity, and there also seemed to be moisture in these feet from probing this field. Total soil moisture depletion is remaining steady.

This site received 0.65-.70 last week and the sensors were re-installed once planting occurred. There were some strange readings in the sensors so I didn’t show the graphs last week. In probing the field, there seemed to be moisture in the top two feet. Thus, I couldn’t understand 2 foot readings shown here. I had reprimed the 2′ sensor last week so I knew it was working. It got installed deeper than 24″ and in probing the soil, it is dry and cumbly below 24″ which seems to be reflected here. Thus why I put 2+’ in the graph for the sensor reading.
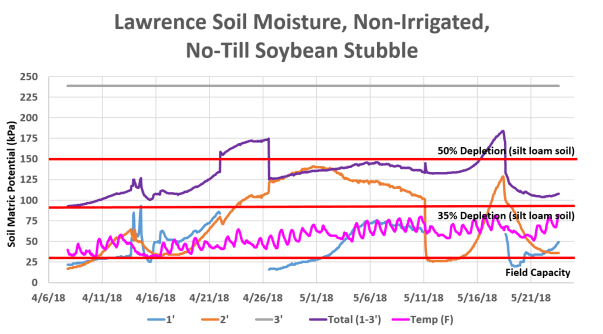
This site, across the road from the corn site, also received 0.65-0.70″ of rain. I also probed this field this week. Total soil moisture depletion is around 40% for this field. The second foot where these sensors are located is in a heavy clay in this field compared to the corn field.
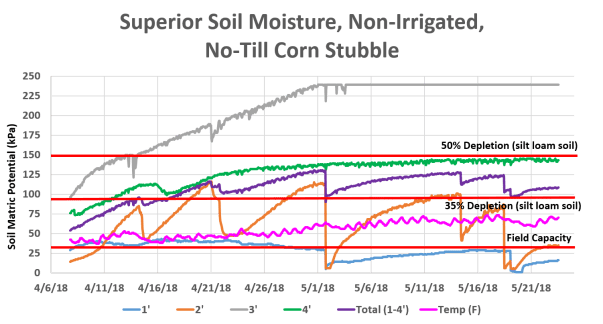
At Superior, a moisture event of 1.05″ was received May 18. This helped add moisture into the top two feet with the second foot around field capacity now. Total soil moisture depletion is around 37%. I also probed this field and there appeared to be moisture in the top two feet and it got dry after that.
Posted on May 27, 2018, in Soil Moisture and tagged Soil Moisture. Bookmark the permalink. Leave a comment.


Leave a comment
Comments 0