Soil Moisture 7-11-18

Drought monitor as of 7-9-18. From the moisture graphs below, I don’t agree that at least portions of Nuckolls and Thayer counties were removed from drought status and other portions of our region no longer show abnormally dry. Even though we were blessed with some large rain events, the moisture really helped only the top two feet of the profile since in areas of this region, the soil moisture status had never fully recharged at the 3 and 4 foot levels. I did not provide graphs last week for groundtruthing as I took a few days off over July 4th. We will see how or if this is adjusted in the future.

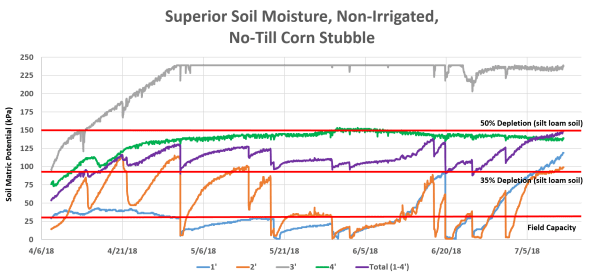
This location received 1″ prior to 6/29 since the last graph and ? on July ? Total soil moisture depletion for this location (top 4 feet) is around 30% depletion based on this graph. The third foot is actually hard and dry compared to how wet it showed the past several weeks on these graphs, so I’m unsure if there’s an old root or earthworm channel that’s been keeping the sensor reading wetter than what I actually probe. But it is now drying back out in this graph. Corn at this location is pollinating.
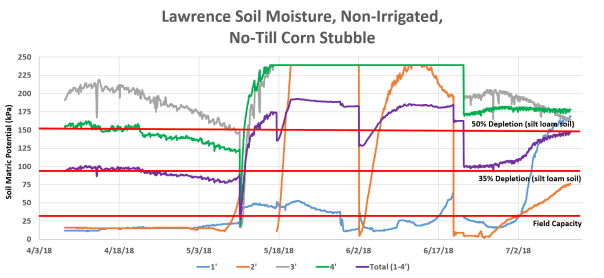
Total rains received since the last graph are ? Total soil moisture depletion (top 4 feet) is at 50%. Corn at this location was three leaves from tasseling on 7/11.
Since the last graph, this location has received ? of rain. Total soil moisture depletion (top four feet) in this field is at 50% depletion. Soybean at this location is nearing beginning pod.
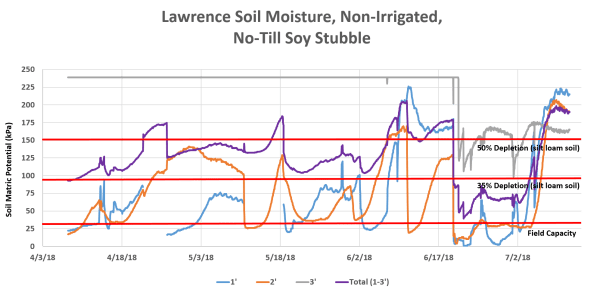
Rains received since the last time I showed graphs are ? Total soil moisture depletion (top three feet) is showing above 50% depletion. Corn at this location is pollinating.

This location has received some rains and current total soil moisture is around field capacity for this field. Corn is pollinating at this location.
This location has been blessed with rains. It wasn’t difficult to install these sensors and the total depletion (currently showing top three feet) around 30% depletion. I hadn’t hooked up the fourth foot sensor yet, thus why no readings are shown this week for it. Corn is pollinating at this location.

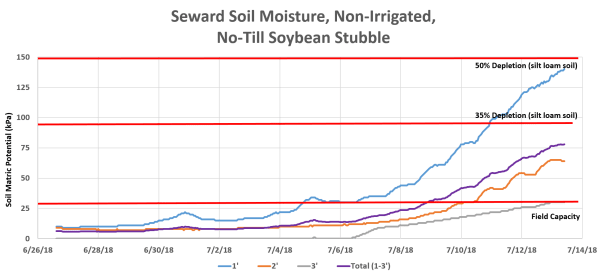
This location received 4.5″ of rain on ? which helped with the top two feet of the profile. An additional ? was received on July 1. Since then, no significant rainfall has been received at this location with the soil moisture depletion (four feet total) around 35%. Soybean is at beginning pod at this location.
Posted on July 15, 2018, in Soil Moisture and tagged drought, Soil Moisture, soil moisture sensors. Bookmark the permalink. Leave a comment.


Leave a comment
Comments 0