JenREES 7/11/21
Resiliency and Rest: Resiliency is the ability to withstand hardship. As I was thinking this past weekend about the July 9th storms and various levels of damage, I was thinking how resilient people can be with the right tools. Tools such as purpose, perspective, positive relationships (talking/checking in with others), self-awareness, and faith can be of help. Another thing I’ll throw in here is rest. The sun, heat, and humidity have been intense and exhausting. Most people I’ve interacted with have been going hard trying to keep pivots going, scout fields, and/or deal with breakdowns of various sorts. We all need rest and I hope in some way, we all intentionally take some time for that, even if just a few hours. I did that too a couple afternoons to get out of the heat, which helped me.
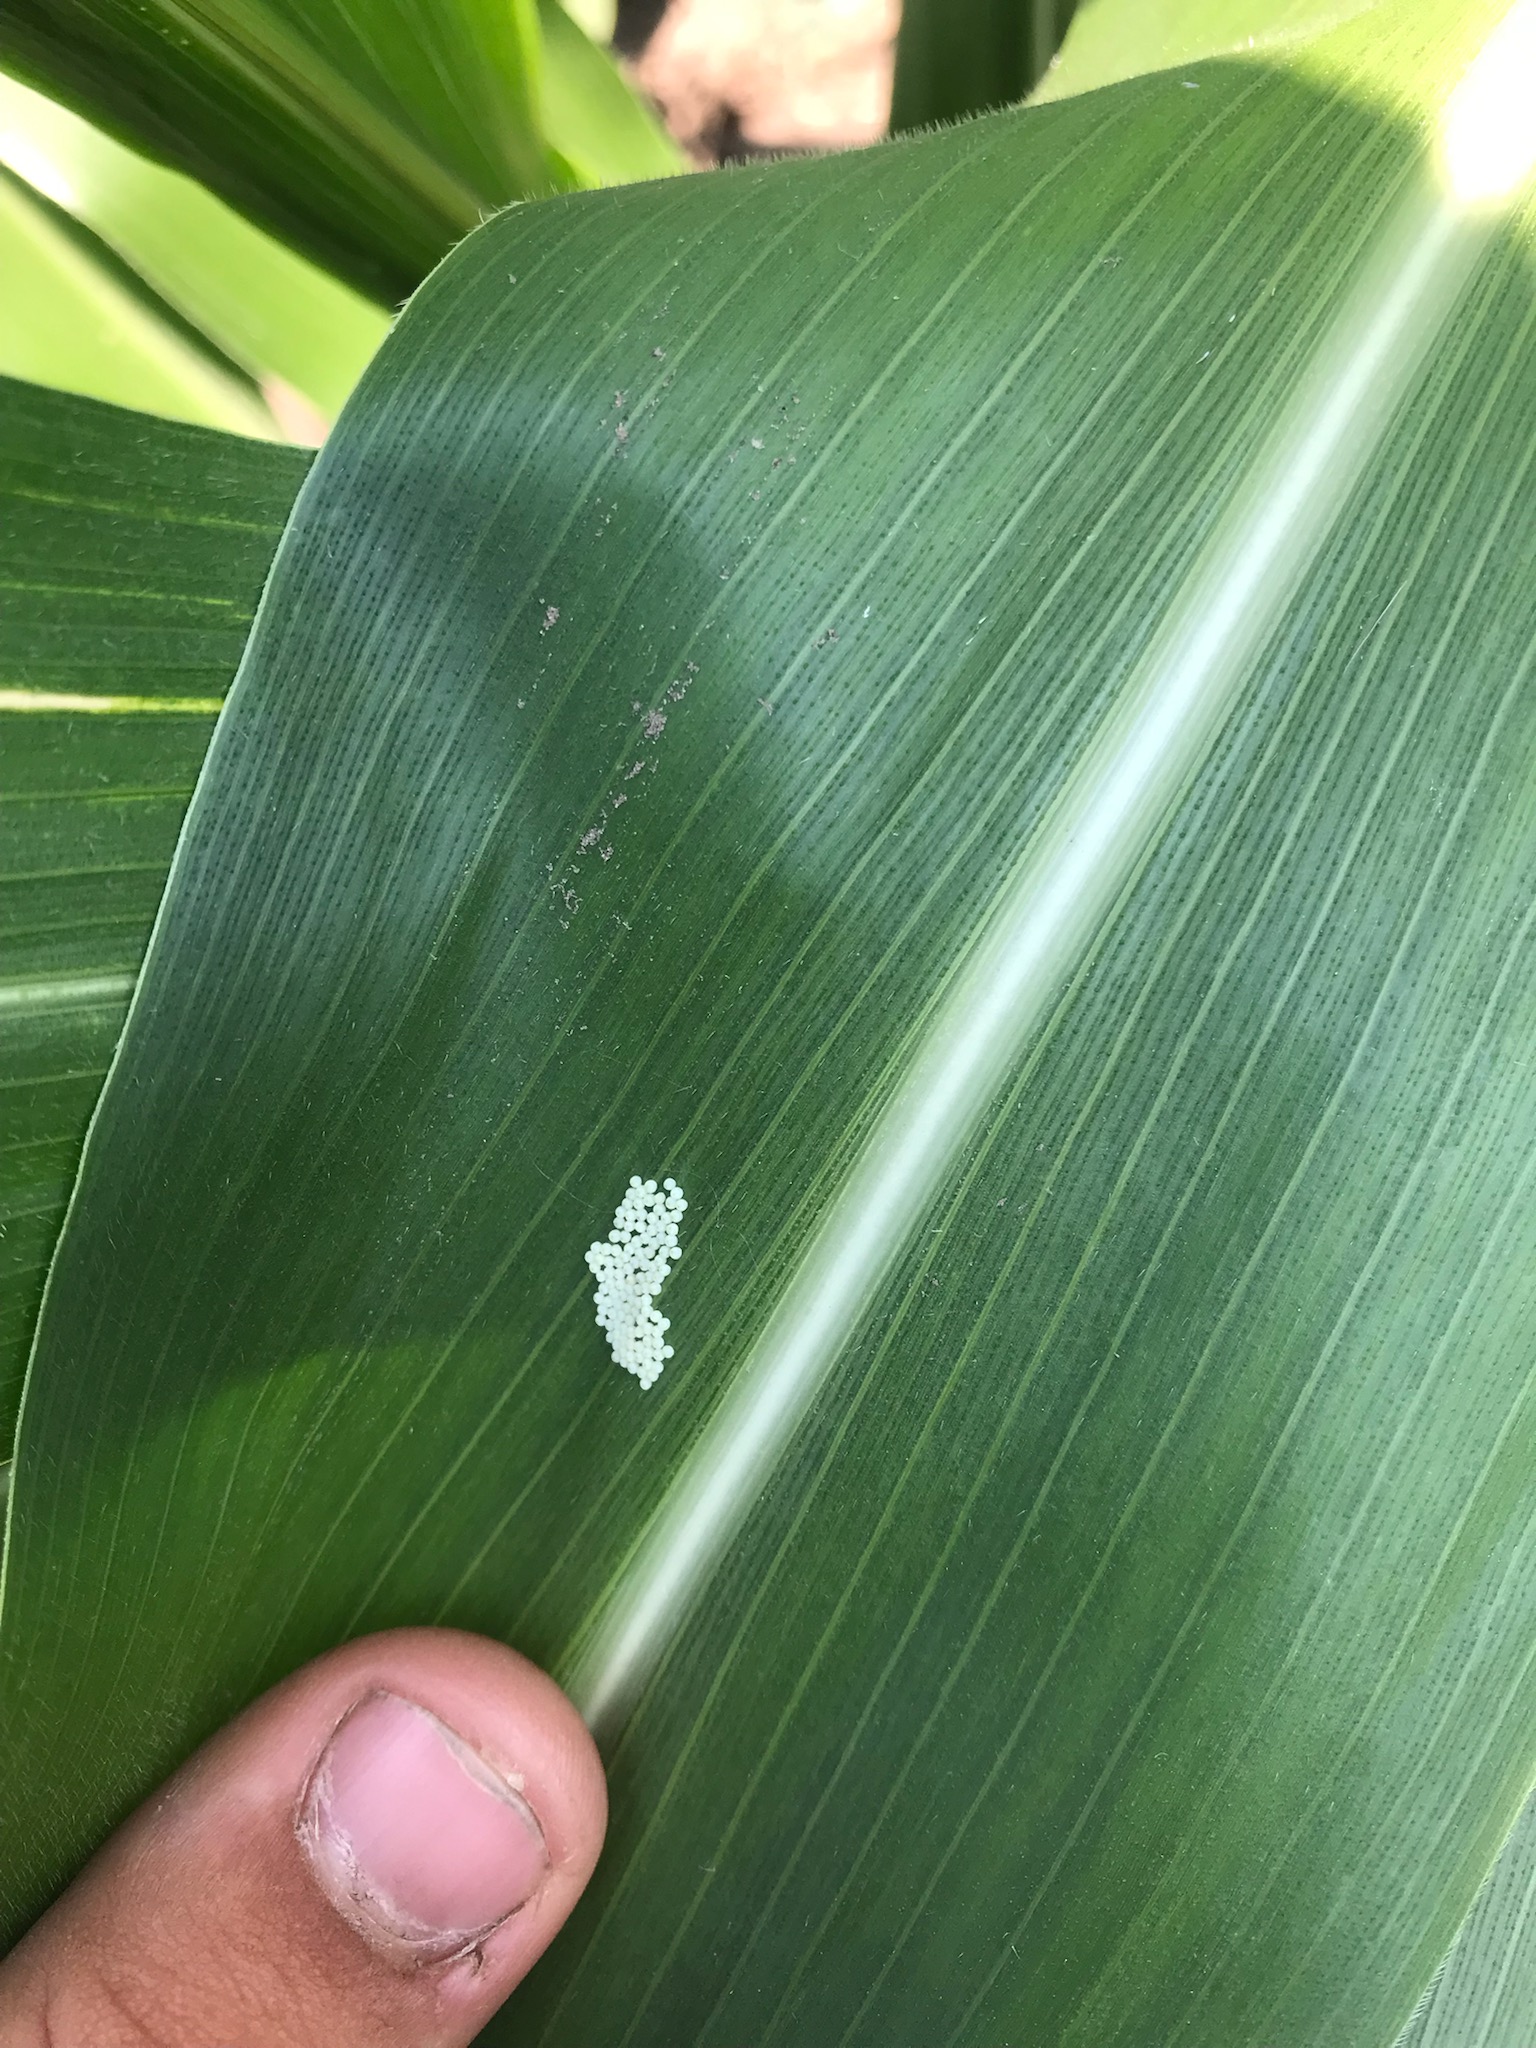
I was also thinking how resilient living things in general can be…such as the corn plants that bent or leaned instead of broke. I don’t have much update right now on the extent of damage as each field will vary depending on growth stage, hybrid, wind and we will learn more as we spend more time in fields this coming week. For those tracking GDD for western bean cutworm moth, you can do so at: https://mesonet.unl.edu/page/data (Select “Western Bean cutworm GDD” from the drop-down menu). Right now it’s showing GDD accumulation to not be as advanced as the CropWatch article was predicting for moth flights (was predicting 75% moth flight for York on July 13th.
Tree Damage: For those with tree damage, be sure to use the ‘3 cut method’ when trimming branches from trees. Also, look for power lines before approaching the tree. You can see a picture of this method at jenreesources.com.

Japanese Beetles or ‘something is eating my plants’ was the primary question I received last week. I’m seeing less in my landscape after the windstorm, so perhaps that helped somewhat?
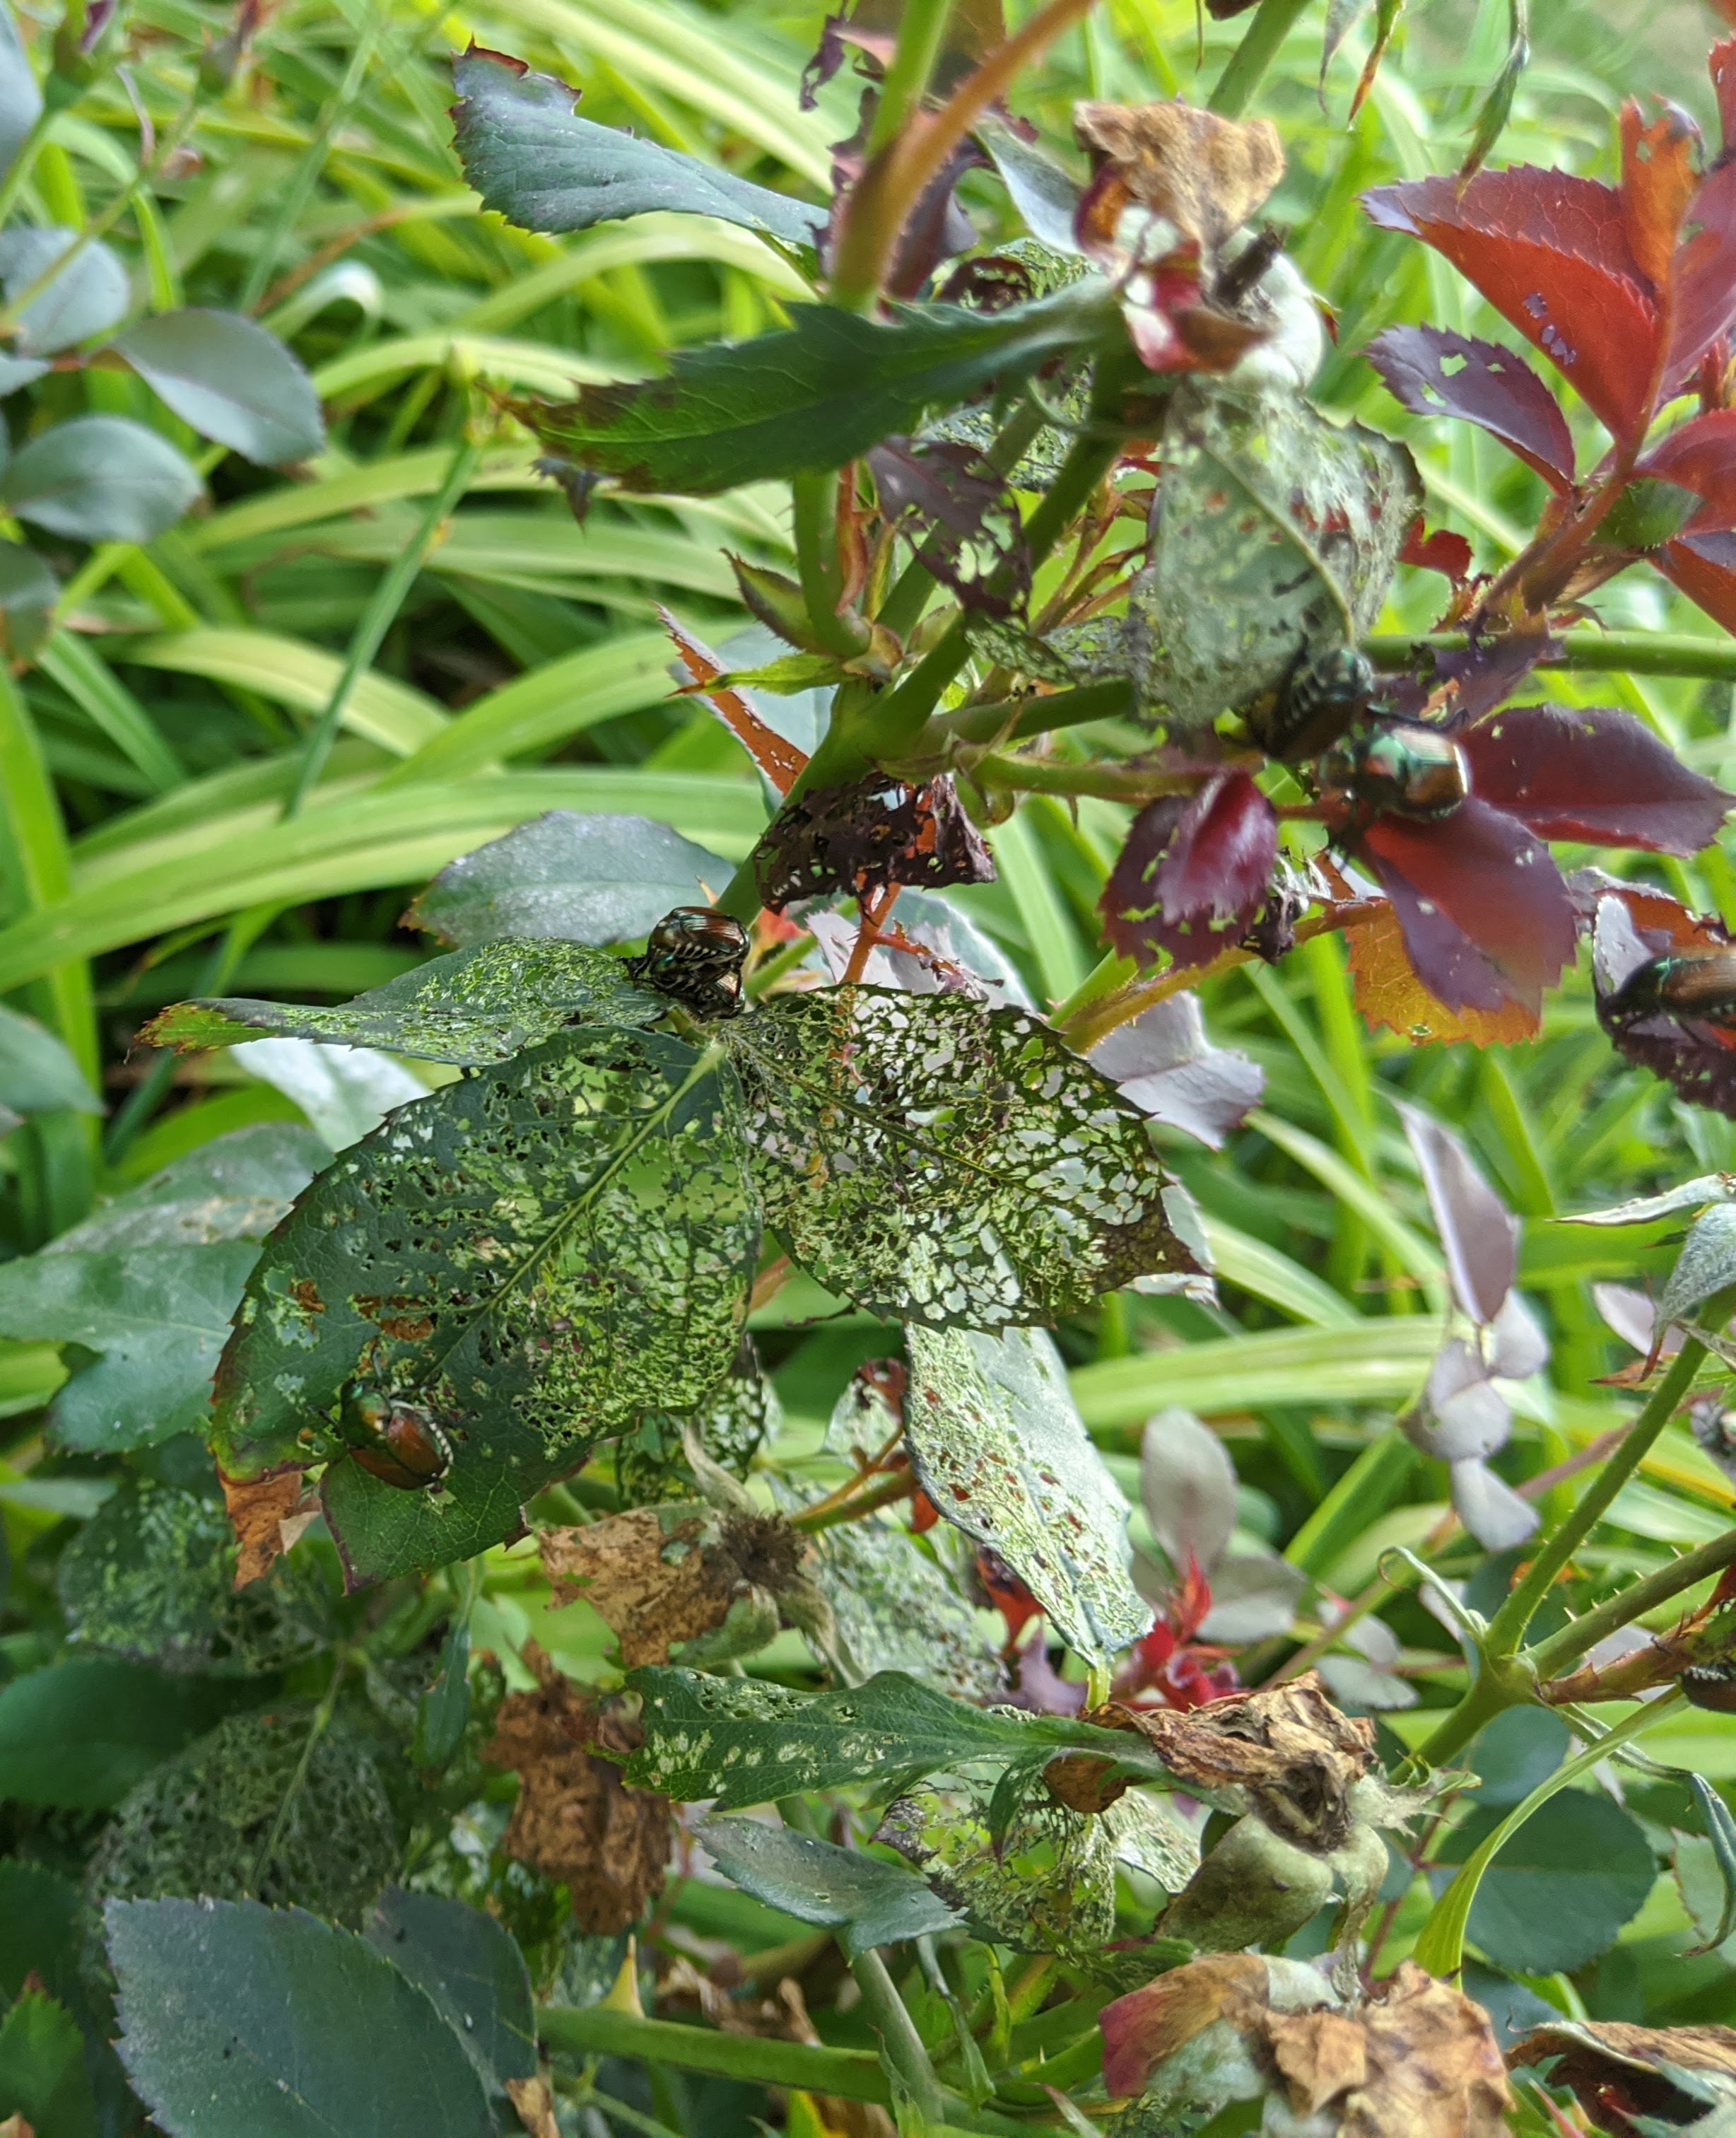
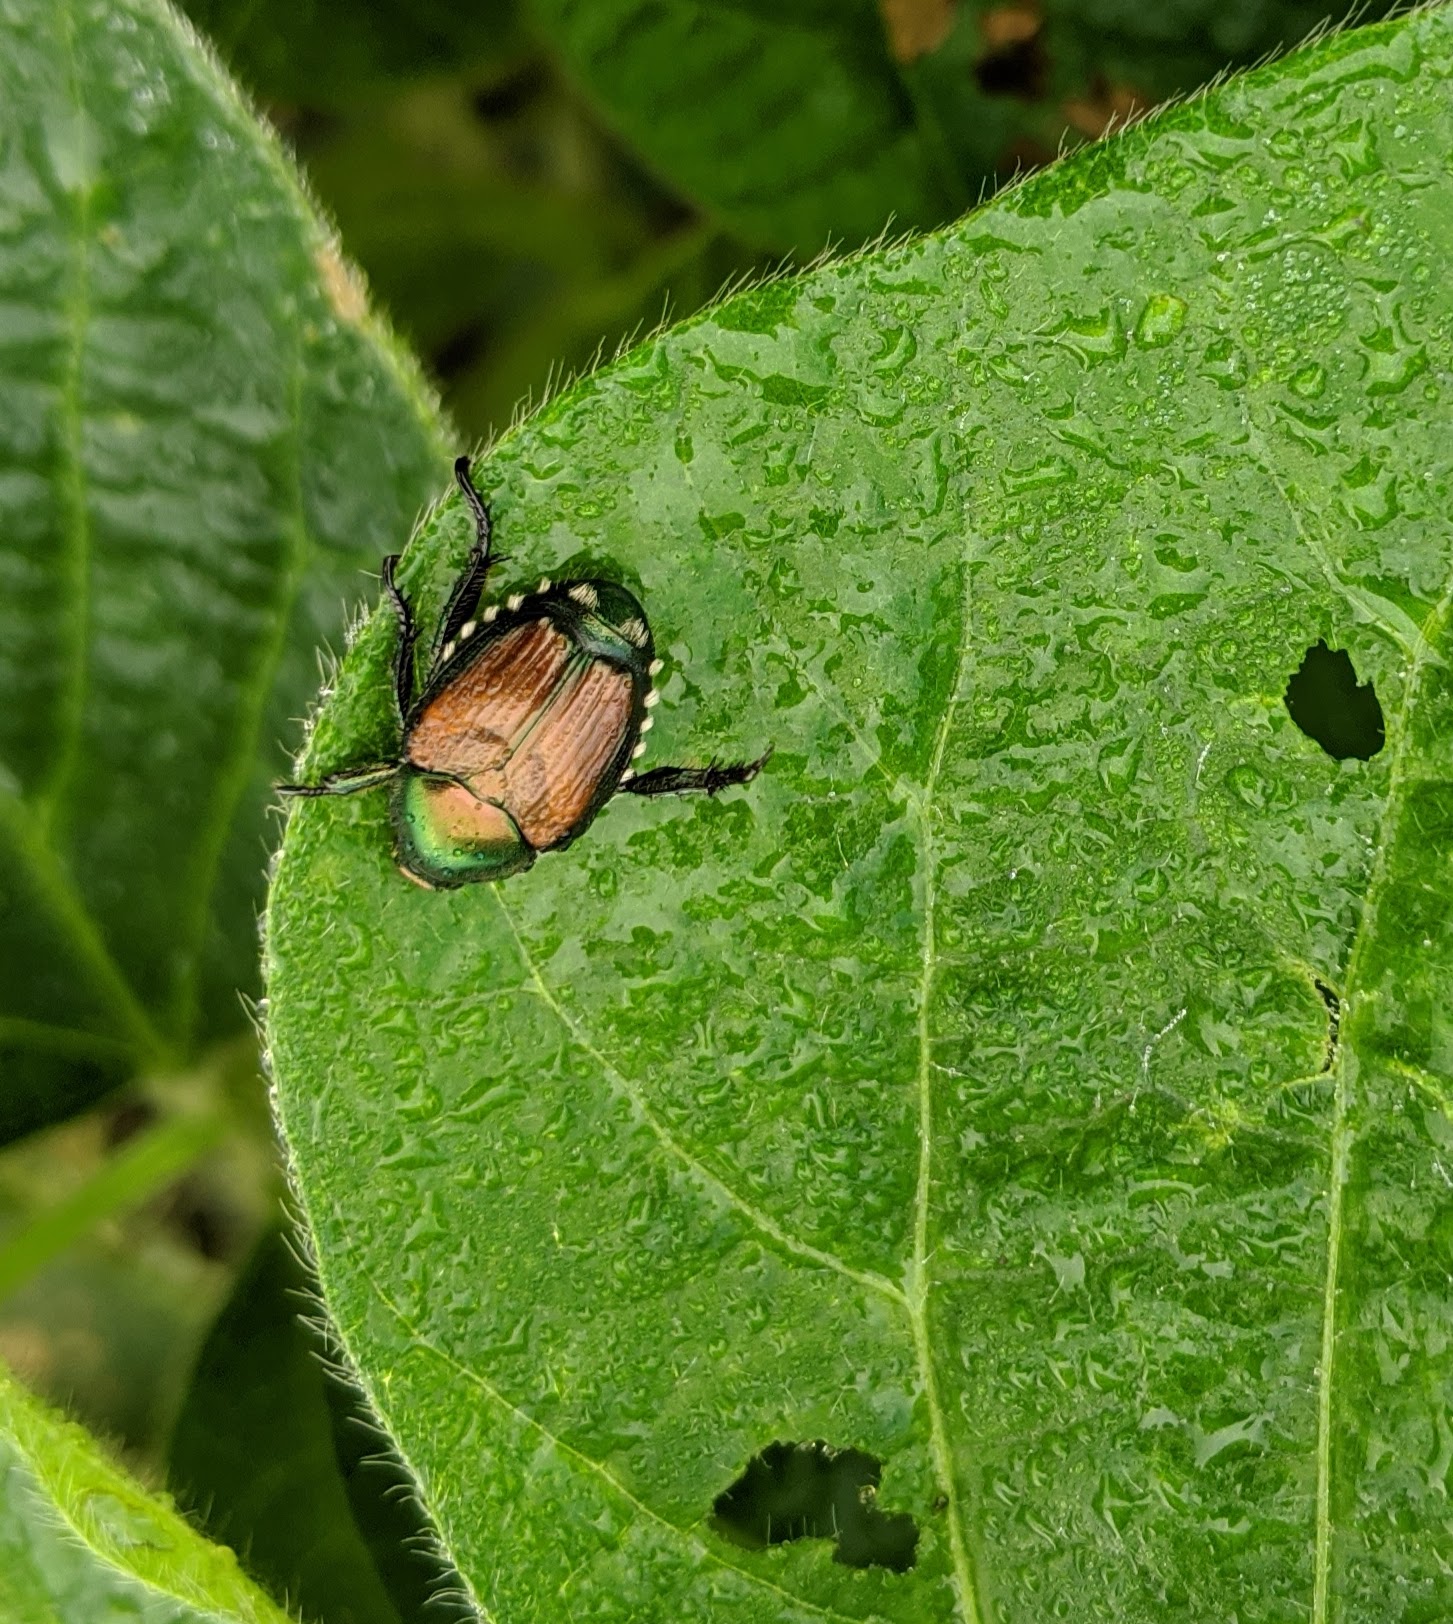
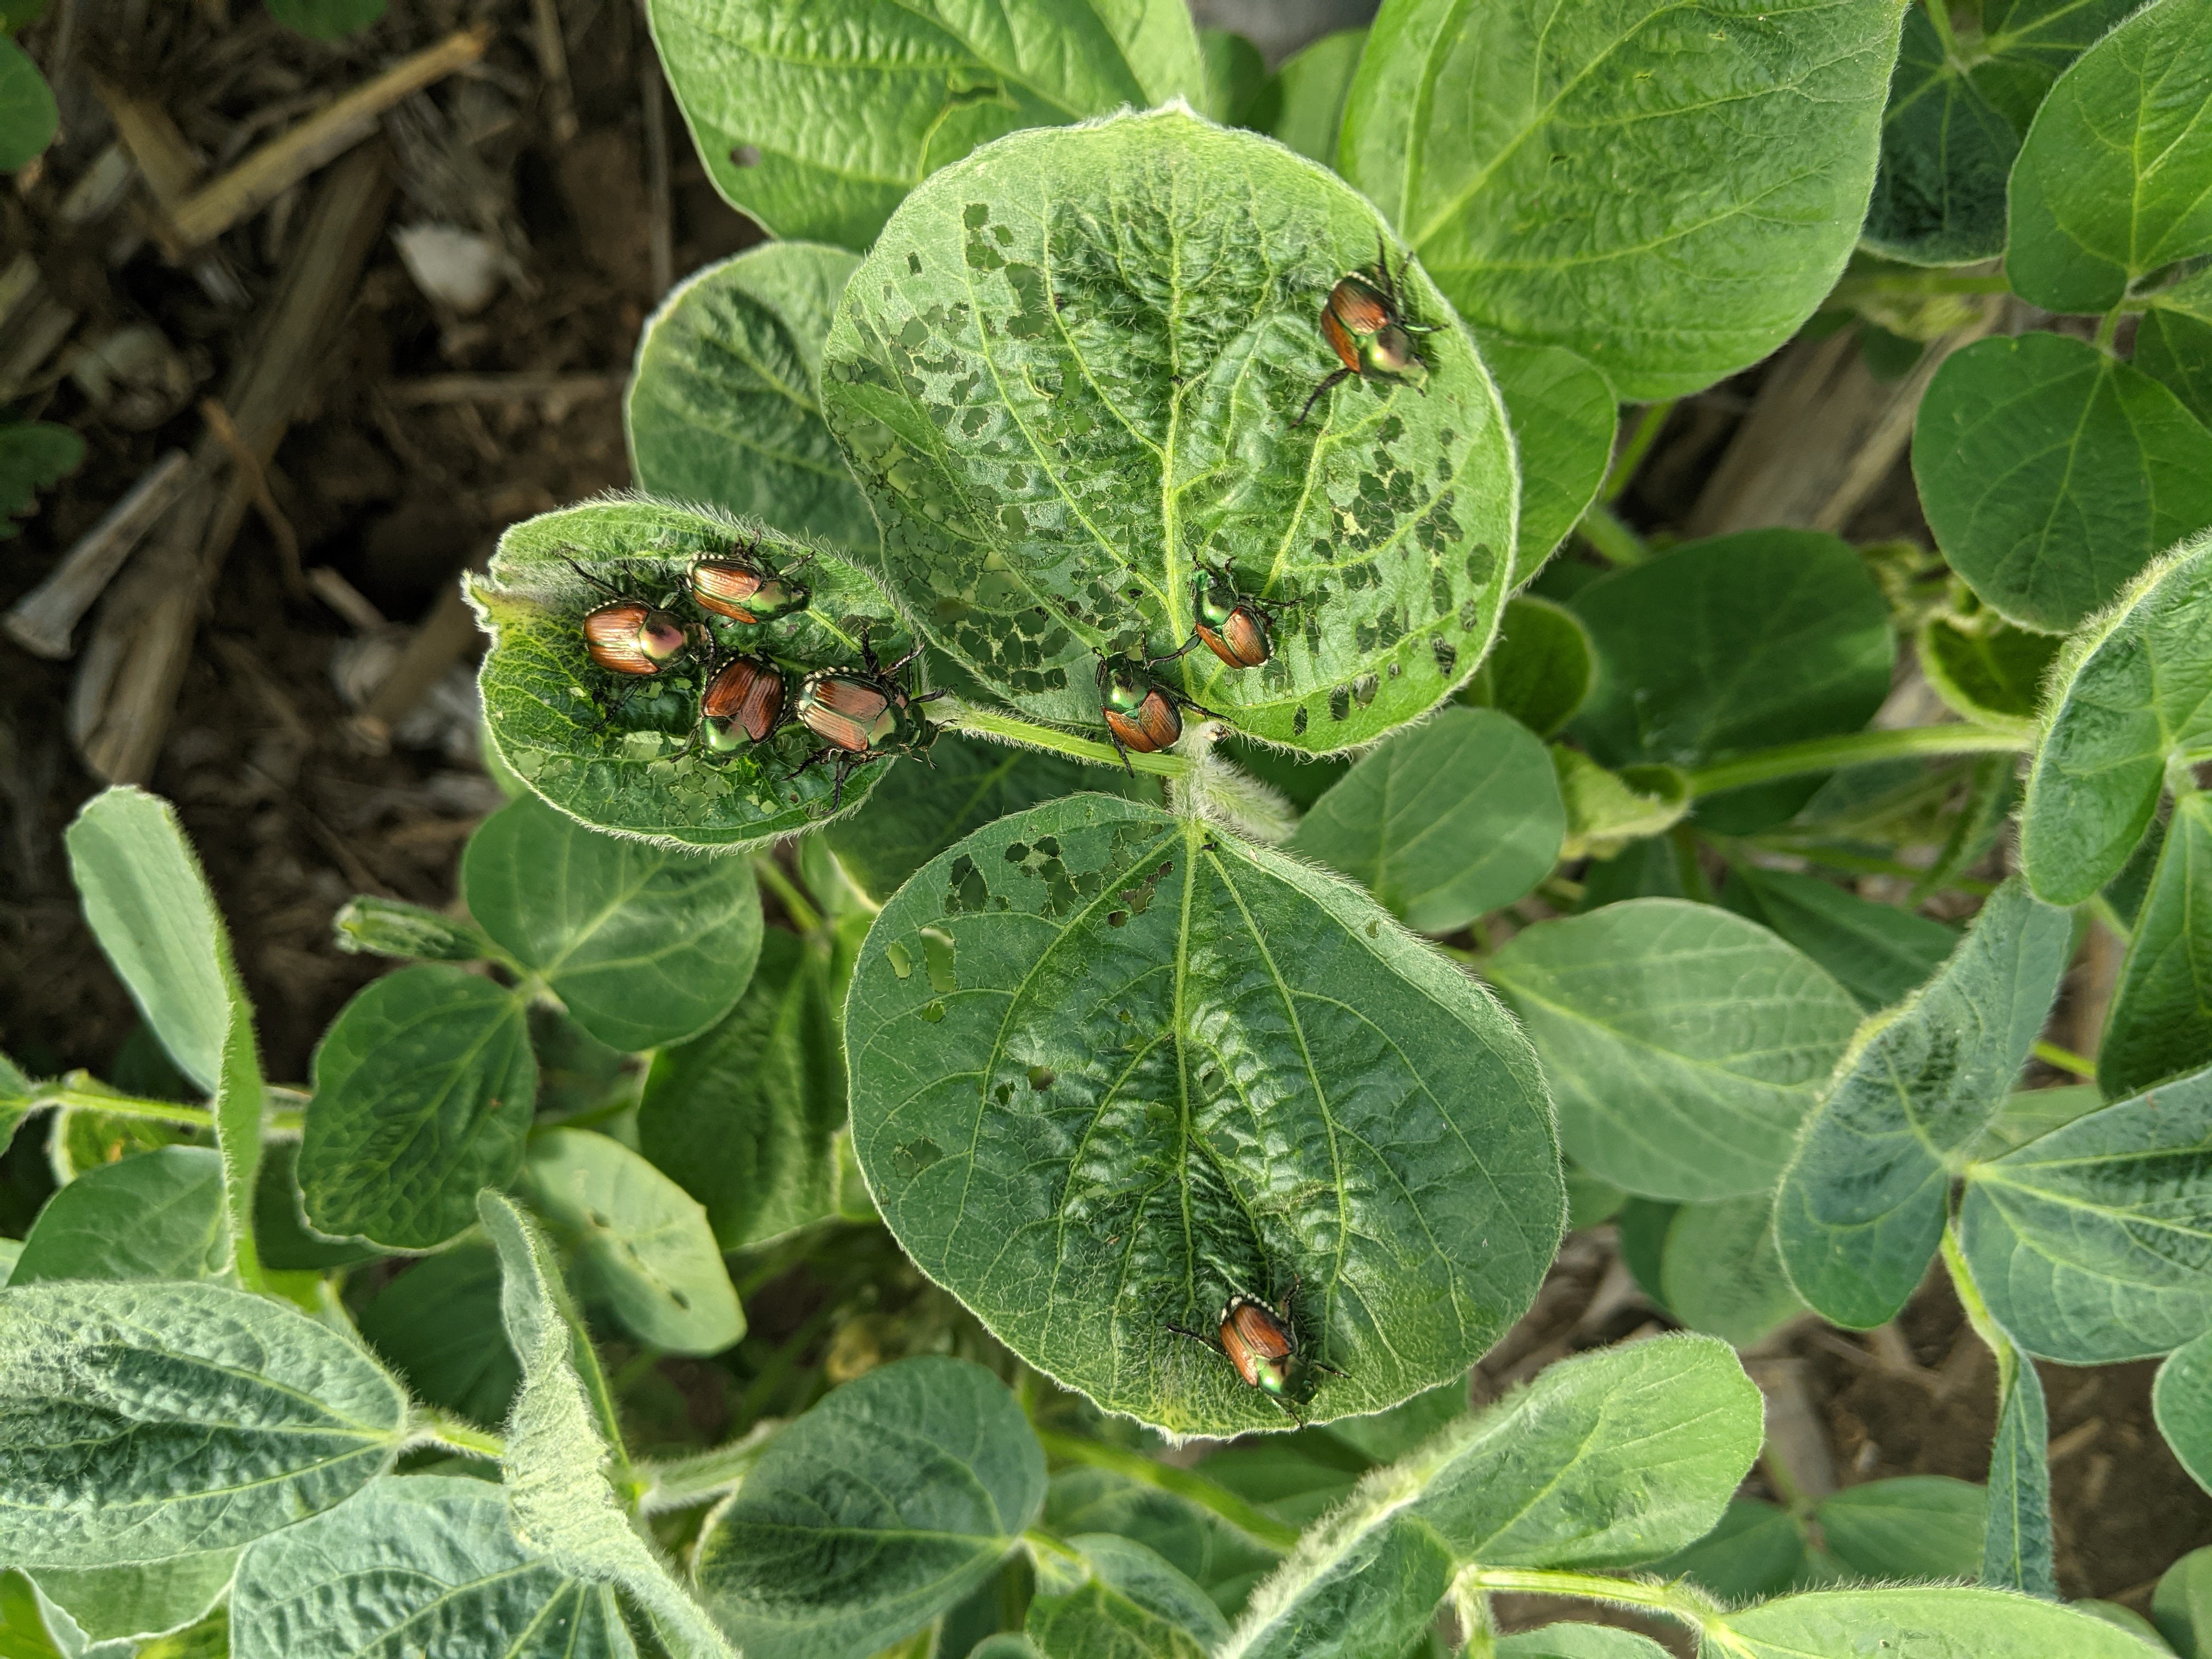
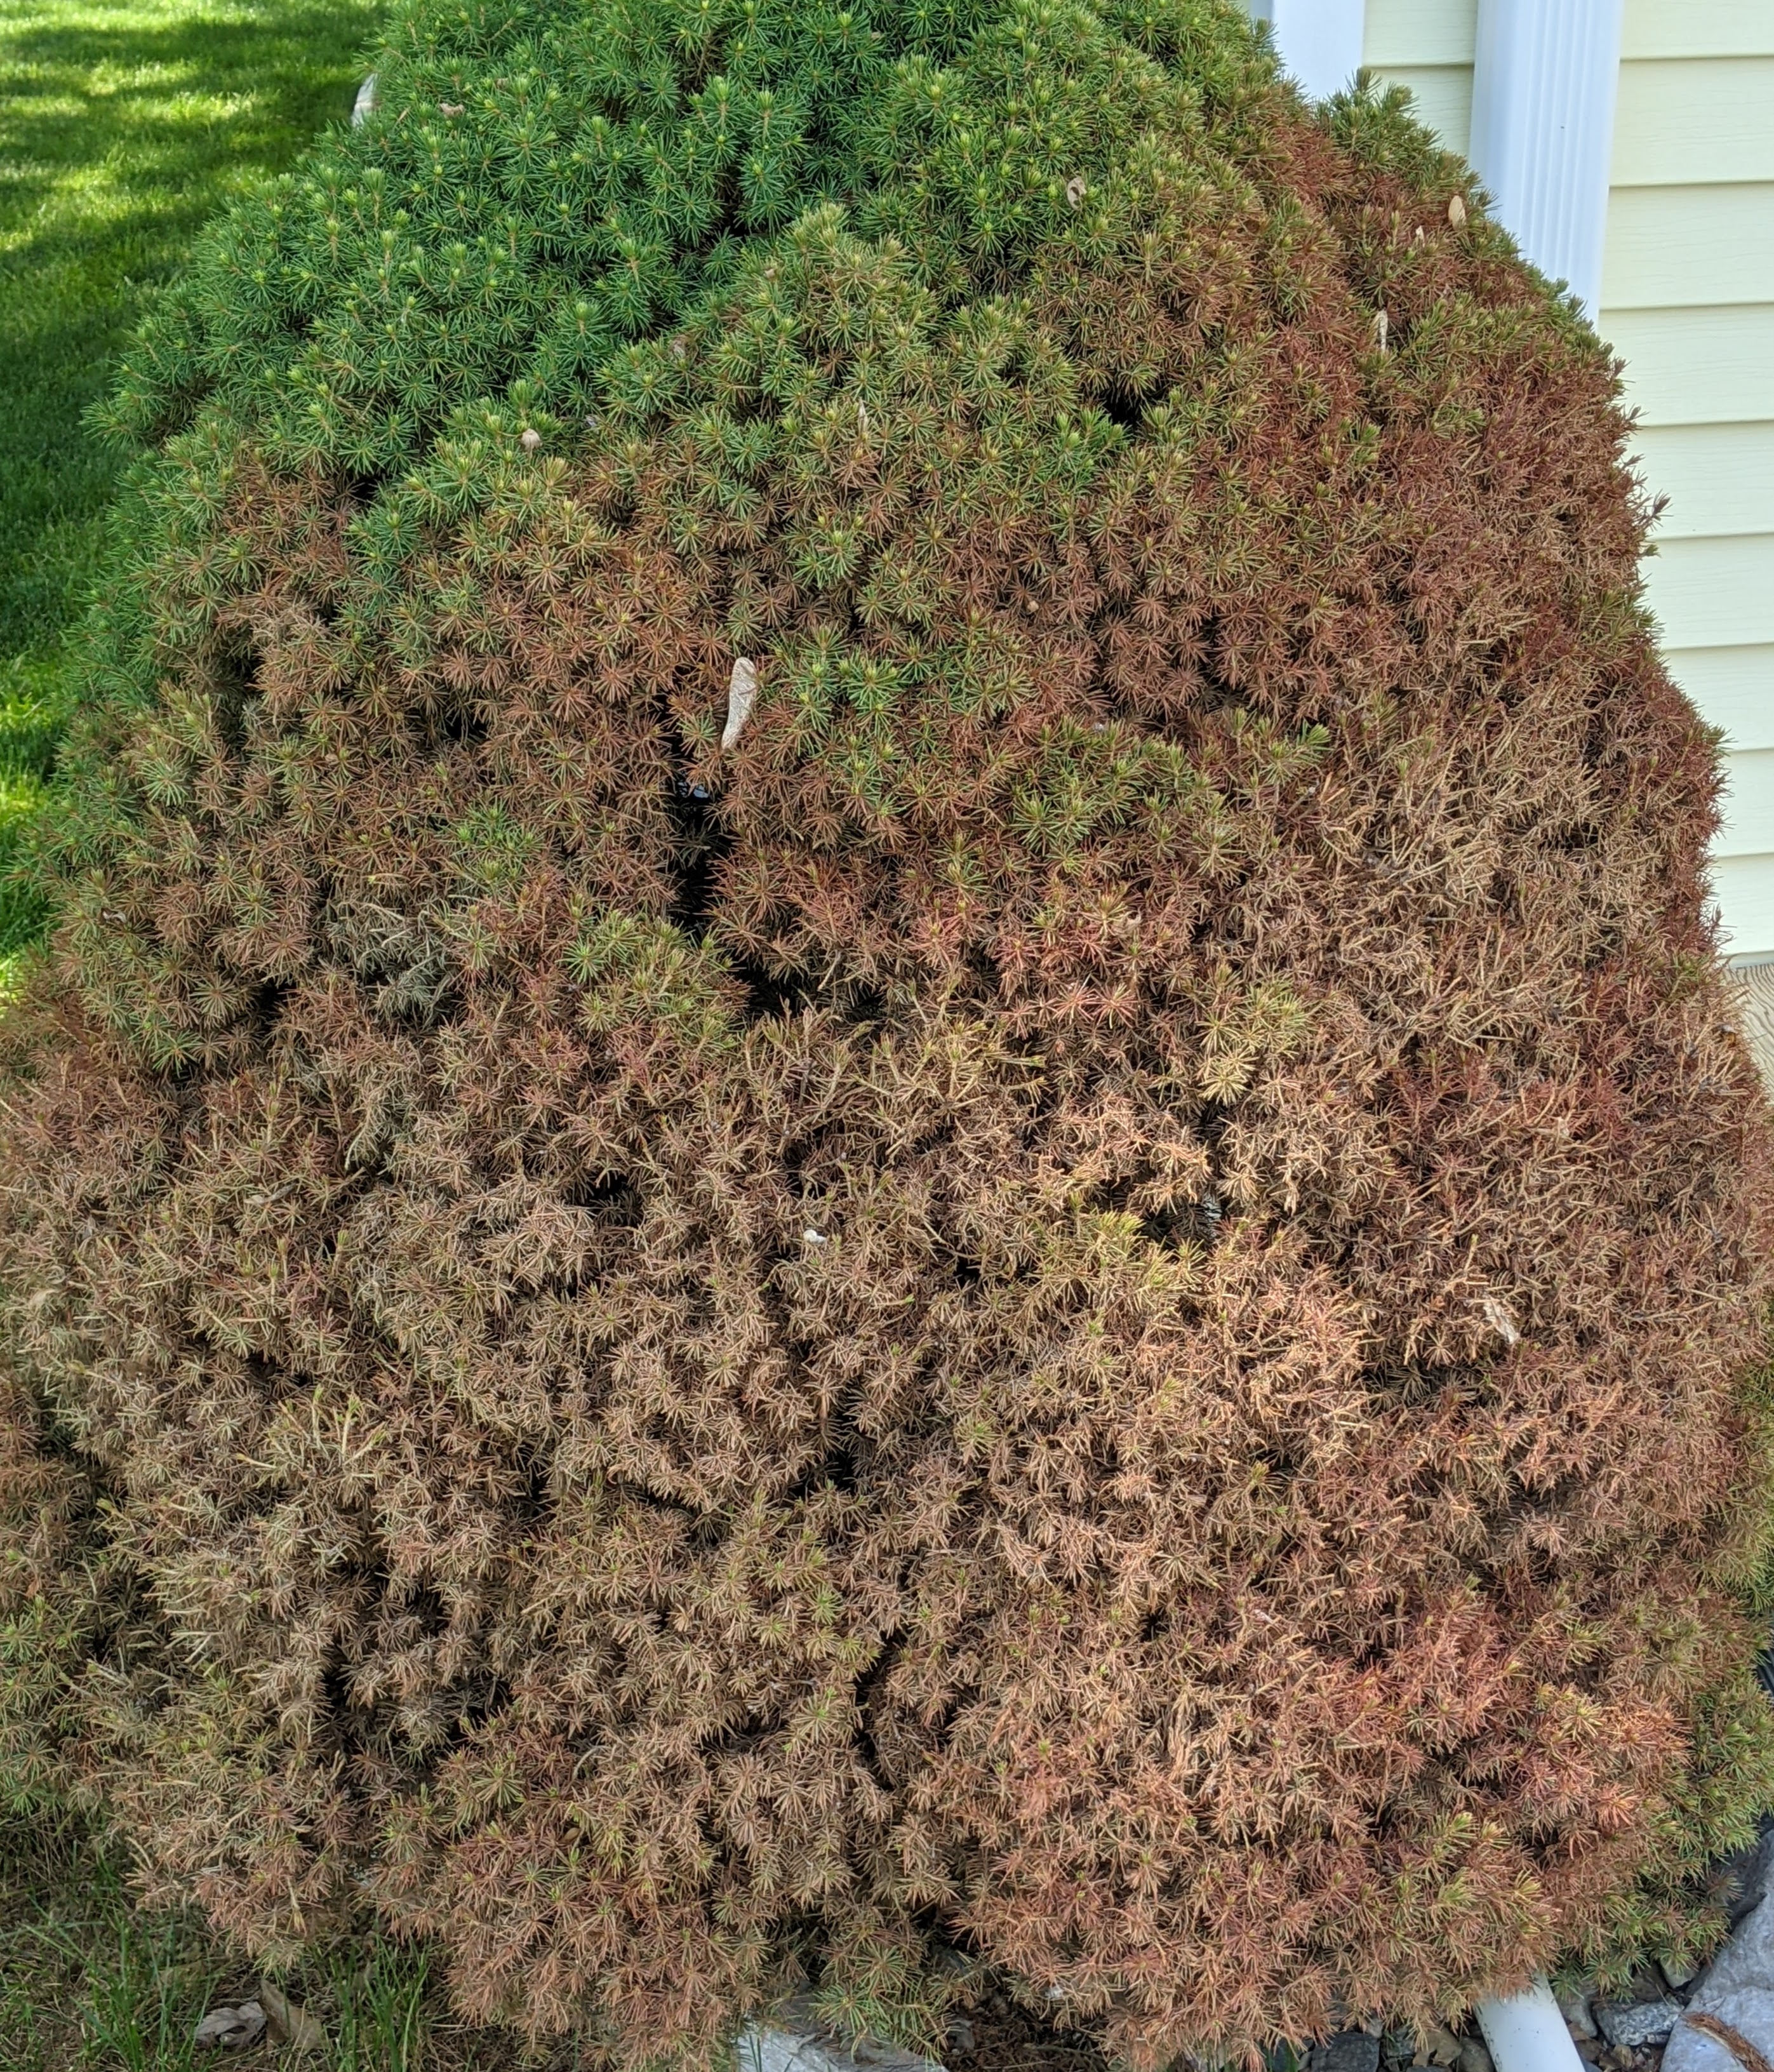
The adult beetle is ½” in length with a metallic green head and white ‘tufts’ that look like spots on its abdomen. Adults feed on 300 plant species, but their favorites are ones that are in many of our landscapes (roses, cannas, marigolds, grapes, Virginia creeper, and trees such as lindens, birch, Japanese and Norway maples, cherry, plum, peach, American elm). They also feed on soybean and corn crops. They love hot weather and full sun and feed on leaf tissue during the day (leaf tissue will look skeletonized or lacy and turn brown). Trees may be severely impacted with browning occurring from the top to bottom. Thankfully healthy trees will re-leaf next year since the underlying twigs and branches aren’t damaged-even if the entire canopy is impacted this year. It’s not recommended to remove branches or trees.
DO NOT use Japanese beetle traps!!! Research shows they attract beetles to the landscape and many homeowners I’ve talked with will attest to this!
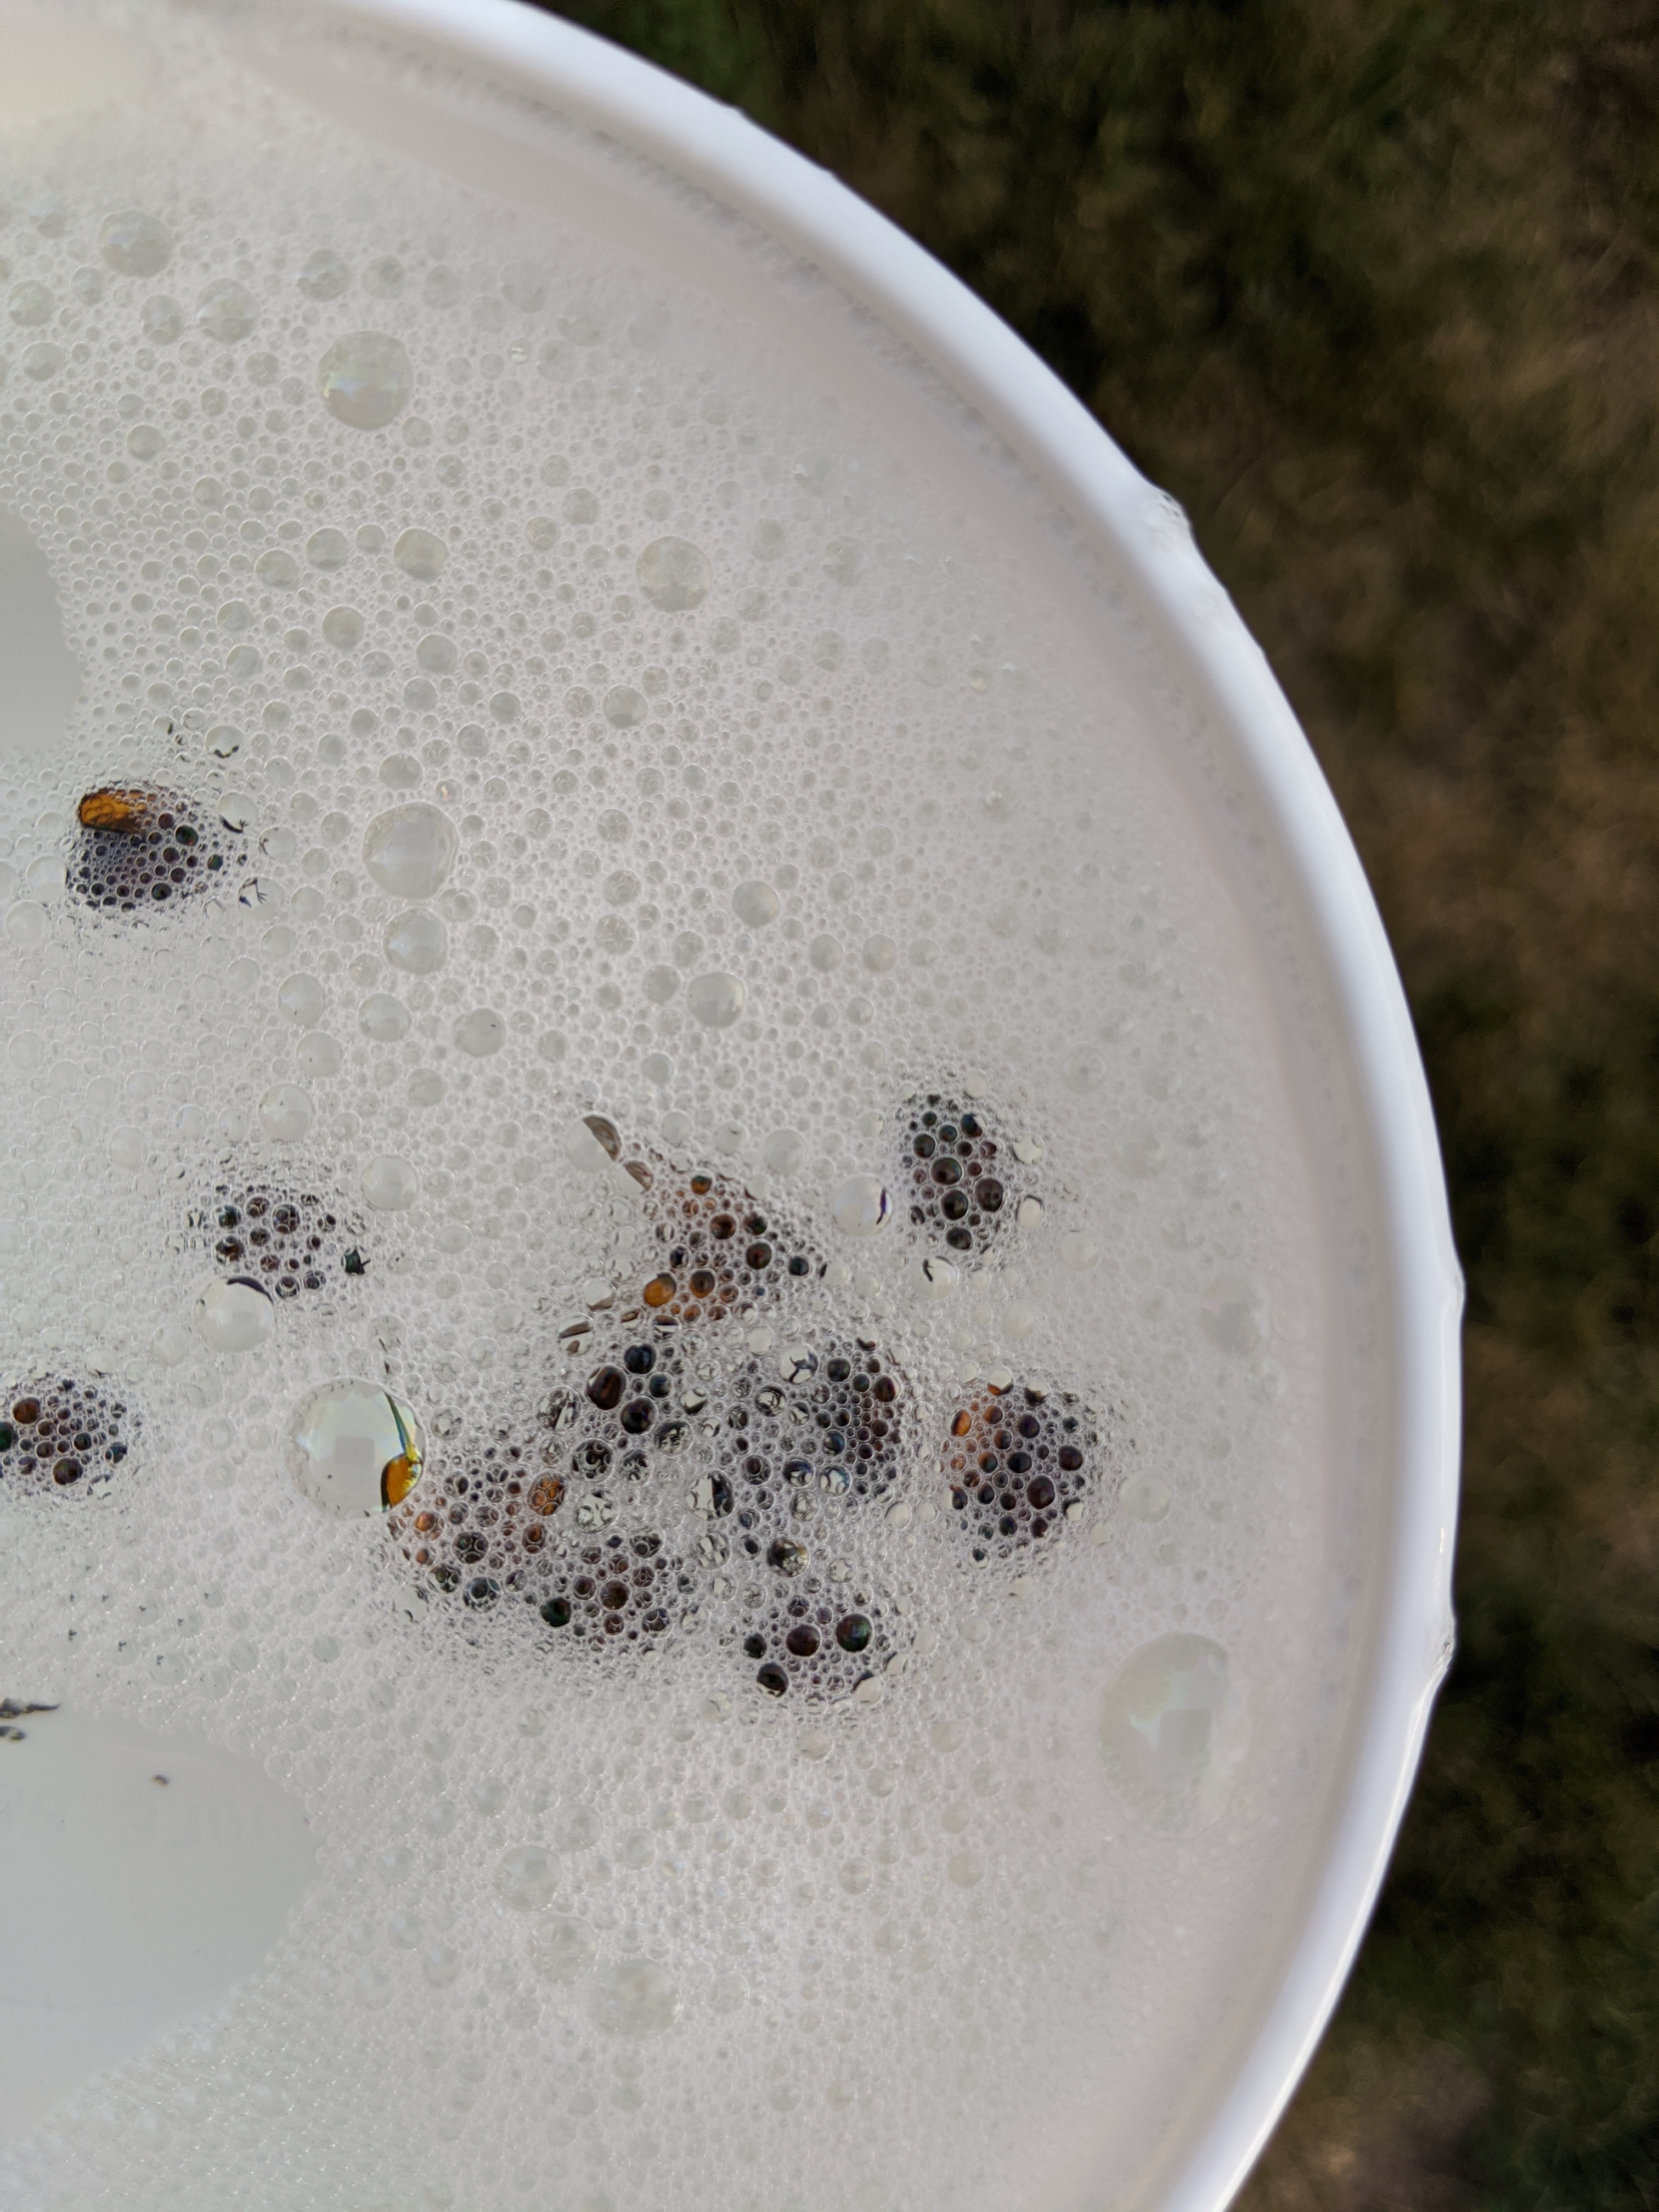
Beetle Control: Organic control options: Wait till 7-9 p.m. then knock beetles off plants into a bucket of soapy water to drown them. This method of control takes diligence over several nights. You can also spray trees with water to knock them down to the ground and then drown in soapy water. With heavy beetle infestations, it’s not uncommon to literally have scoop shovels full of the beetles when removing from trees. Neem and Pyola are two organic sprays that will protect for 3-7 days. Applying these products regularly (once per week) can also be effective as a repellent.
For conventional control options, keep in mind that Japanese beetles often impact the same flowering plants that other pollinators visit. Use insecticide products correctly to avoid damage to pollinators. Avoid spraying insecticides on windy days or when pollinators are present (best to spray late in day near dusk) and be sure to read and follow all label instructions and harvest intervals (for cherries, plums, vegetables, etc.). Conventional insecticides can provide 2 weeks of control: pyrethroid products like Tempo (Tempo can’t be used on vegetables and fruits) and Bayer Advanced Lawn & Garden Multi-Insect Killer (cyfluthrin) or Ortho Bug B Gone (bifenthrin). Sevin (carbaryl) is another option although more dangerous for bees. You can buy these products in most any farm, garden, box store…it may not be the exact products listed here, but if the active ingredient is a pyrethroid or any of those listed in parentheses above AND the product is labeled for the plant you wish to apply it to, you can apply it. Just be sure to read and follow label instructions.
Corn and Soybean Thresholds: Soybean thresholds are 20% defoliation in the reproductive stages. Thresholds for corn are: three or more Japanese beetles per ear, silks have been clipped to less than ½ inch, AND pollination is less than 50% complete. Pyrethroids are very effective against beetles. If one is concerned about flaring spidermites, a product like bifenthrin can be used.
Wellbeing Tips:
(Adapted from: Gilbert Parra, PhD; Holly Hatton-Bowers, PhD, and Carrie Gottschalk, LMHP, MS)
How Much Time do You Have?
2 Minutes:
- Breathe
- Stretch
- Laugh
- Doodle
- Acknowledge one of your accomplishments
- Say no to a new responsibility
- Look out the window
- (adapted) Faith based prayer
5 Minutes:
- Listen to music
- Have a cleansing cry
- Chat with a co-worker, friend, or family member
- Sing out loud
- Jot down dreams
- Step outside for fresh air
- Go for a brief walk
- Enjoy a snack or make a cup of coffee/tea
- (adapted) Read faith-based devotional
10 Minutes:
- Evaluate your day, Write in a journal
- Call a friend
- (adapted) Meditate, Prayer, Devotional
- Tidy your work area
- Assess your self-care
- Draw a picture
- Listen to soothing sounds/music
- Read a magazine
JenREES 7/4/21

Crops really look tremendous overall and got a report of some first tassels by July 4th as well! It’s been great to see people attending field days again the past few weeks and really appreciated the learning, sharing, discussion, and just watching people catch up with each other at them. I had mentioned before how the lack of freeze/thaw was impeding roots of crops, particularly soybeans in no-till fields. Irrigating and rain has helped them get some growth. What I hadn’t mentioned in my articles was being called to soybean fields with HPPD (Group 27) carryover from corn herbicides in 2020. We had a dry fall but had rain in March and May, so I wasn’t sure how to explain the carryover. One thing I learned last week from a discussion at the palmer amaranth field day was that the lack of freeze/thaw also impacts the ability of herbicides to breakdown. So, I appreciated learning that and am sharing if that helps anyone else as well.
Japanese beetles are also heavy in pockets of the area. I will share more specifics next week. For those who are asking, the threshold for soybean defoliation in reproductive stages is 20%. Tom Hunt, UNL entomologist shared that pyrethroids in general are effective. However, if there’s potential for flaring spidermites due to dry conditions, bifenthrin is a consideration as it has activity for spidermites (particularly when considering soybeans). For homeowners, beetles can be dislodged off of plants right now in evening hours by knocking them into buckets of dishsoap water. Do not use pheromone traps as they will actually attract beetles to your yard!
Western Bean Cutworm: With crops nearing tassel, it’s time to be scouting for western bean cutworm moths and egg masses. There was a CropWatch article posted this week at: https://go.unl.edu/9v4a. It was predicting 5% moth flight for York on June 30th, Harvard July 2nd, and Central City July 3. I received a text from a crop consultant saying he found the first eggmass in the Central City area July 2, so that was pretty well on target! Twenty-five percent of WBC flight occurs when 2,577 degree-days Fahrenheit are reached. Entomologists recommend field scouting should occur at this point. For 25% moth flight, it’s predicting York on July 6th, Harvard area July 8th, and Central City July 9th, so we should start watching fields for sure this week. Look for egg masses laid on the upper surfaces of corn leaves, typically on the top 1/3 of the plant.
Chiggers: I should’ve written about this last week as chigger bites tend to peak around the 4th of July with more families outdoors. Chiggers (also known as redbugs or jiggers) are the immature stages of red harvest mites. They tend to hang out in moist, tall grassy/weedy areas such as along streams, road-side ditches, forested areas, lawns. But they can also hang out in moist and dry lawns with a lot of trees too. They bite humans and other animals including pets. Eggs are laid on clusters on plants and the larvae hatch and wait for their host to come along. They latch onto clothing, shoes, and fur and can hang on while working their way to the skin (often to an area where clothing is tighter like around socks, undergarments, back of knees and under armpits). They actually don’t burrow into human flesh. They only survive on a warm-blooded host for around 3 days before falling off to molt for the next stage in life cycle which doesn’t feed on humans.
They have needle-like mouthparts that allow them to pierce the skin then inject saliva that dissolves body cells in the area to aid them in feeding. Thus, they don’t feed on blood but liquefied cells. The feeding creates an allergic reaction in which many see swelling, intense itching, and small, clustered, red bumps (which can become larger welts in some). To prevent chigger bites, avoid sitting or lying on the ground when picnicking or working outdoors. Wear loose-fitting clothing and apply a repellent like DEET to shoes, socks, and pants before going into areas more favorable for chiggers. It’s also wise to take a hot shower with plenty of soap as soon as possible after being outdoors and launder clothing with hot water before re-wearing. Also launder any blankets/sheets being used outdoors. If you receive bites, rubbing alcohol can be used then apply an anti-itch cream to help reduce itching. Thankfully chiggers can’t live in the home but they can become dislodged in bedding and on floors, so laundering bedding and vacuuming is also wise. Keep lawns and shrubs well-manicured, particularly where adjacent to dwellings. If you tend to have problems with chiggers in your lawn, they can be reduced from 75-95% for several weeks with a liquid treatment of bifenthrin. Be sure to read and follow all label instructions.
JenREES 6/27/21
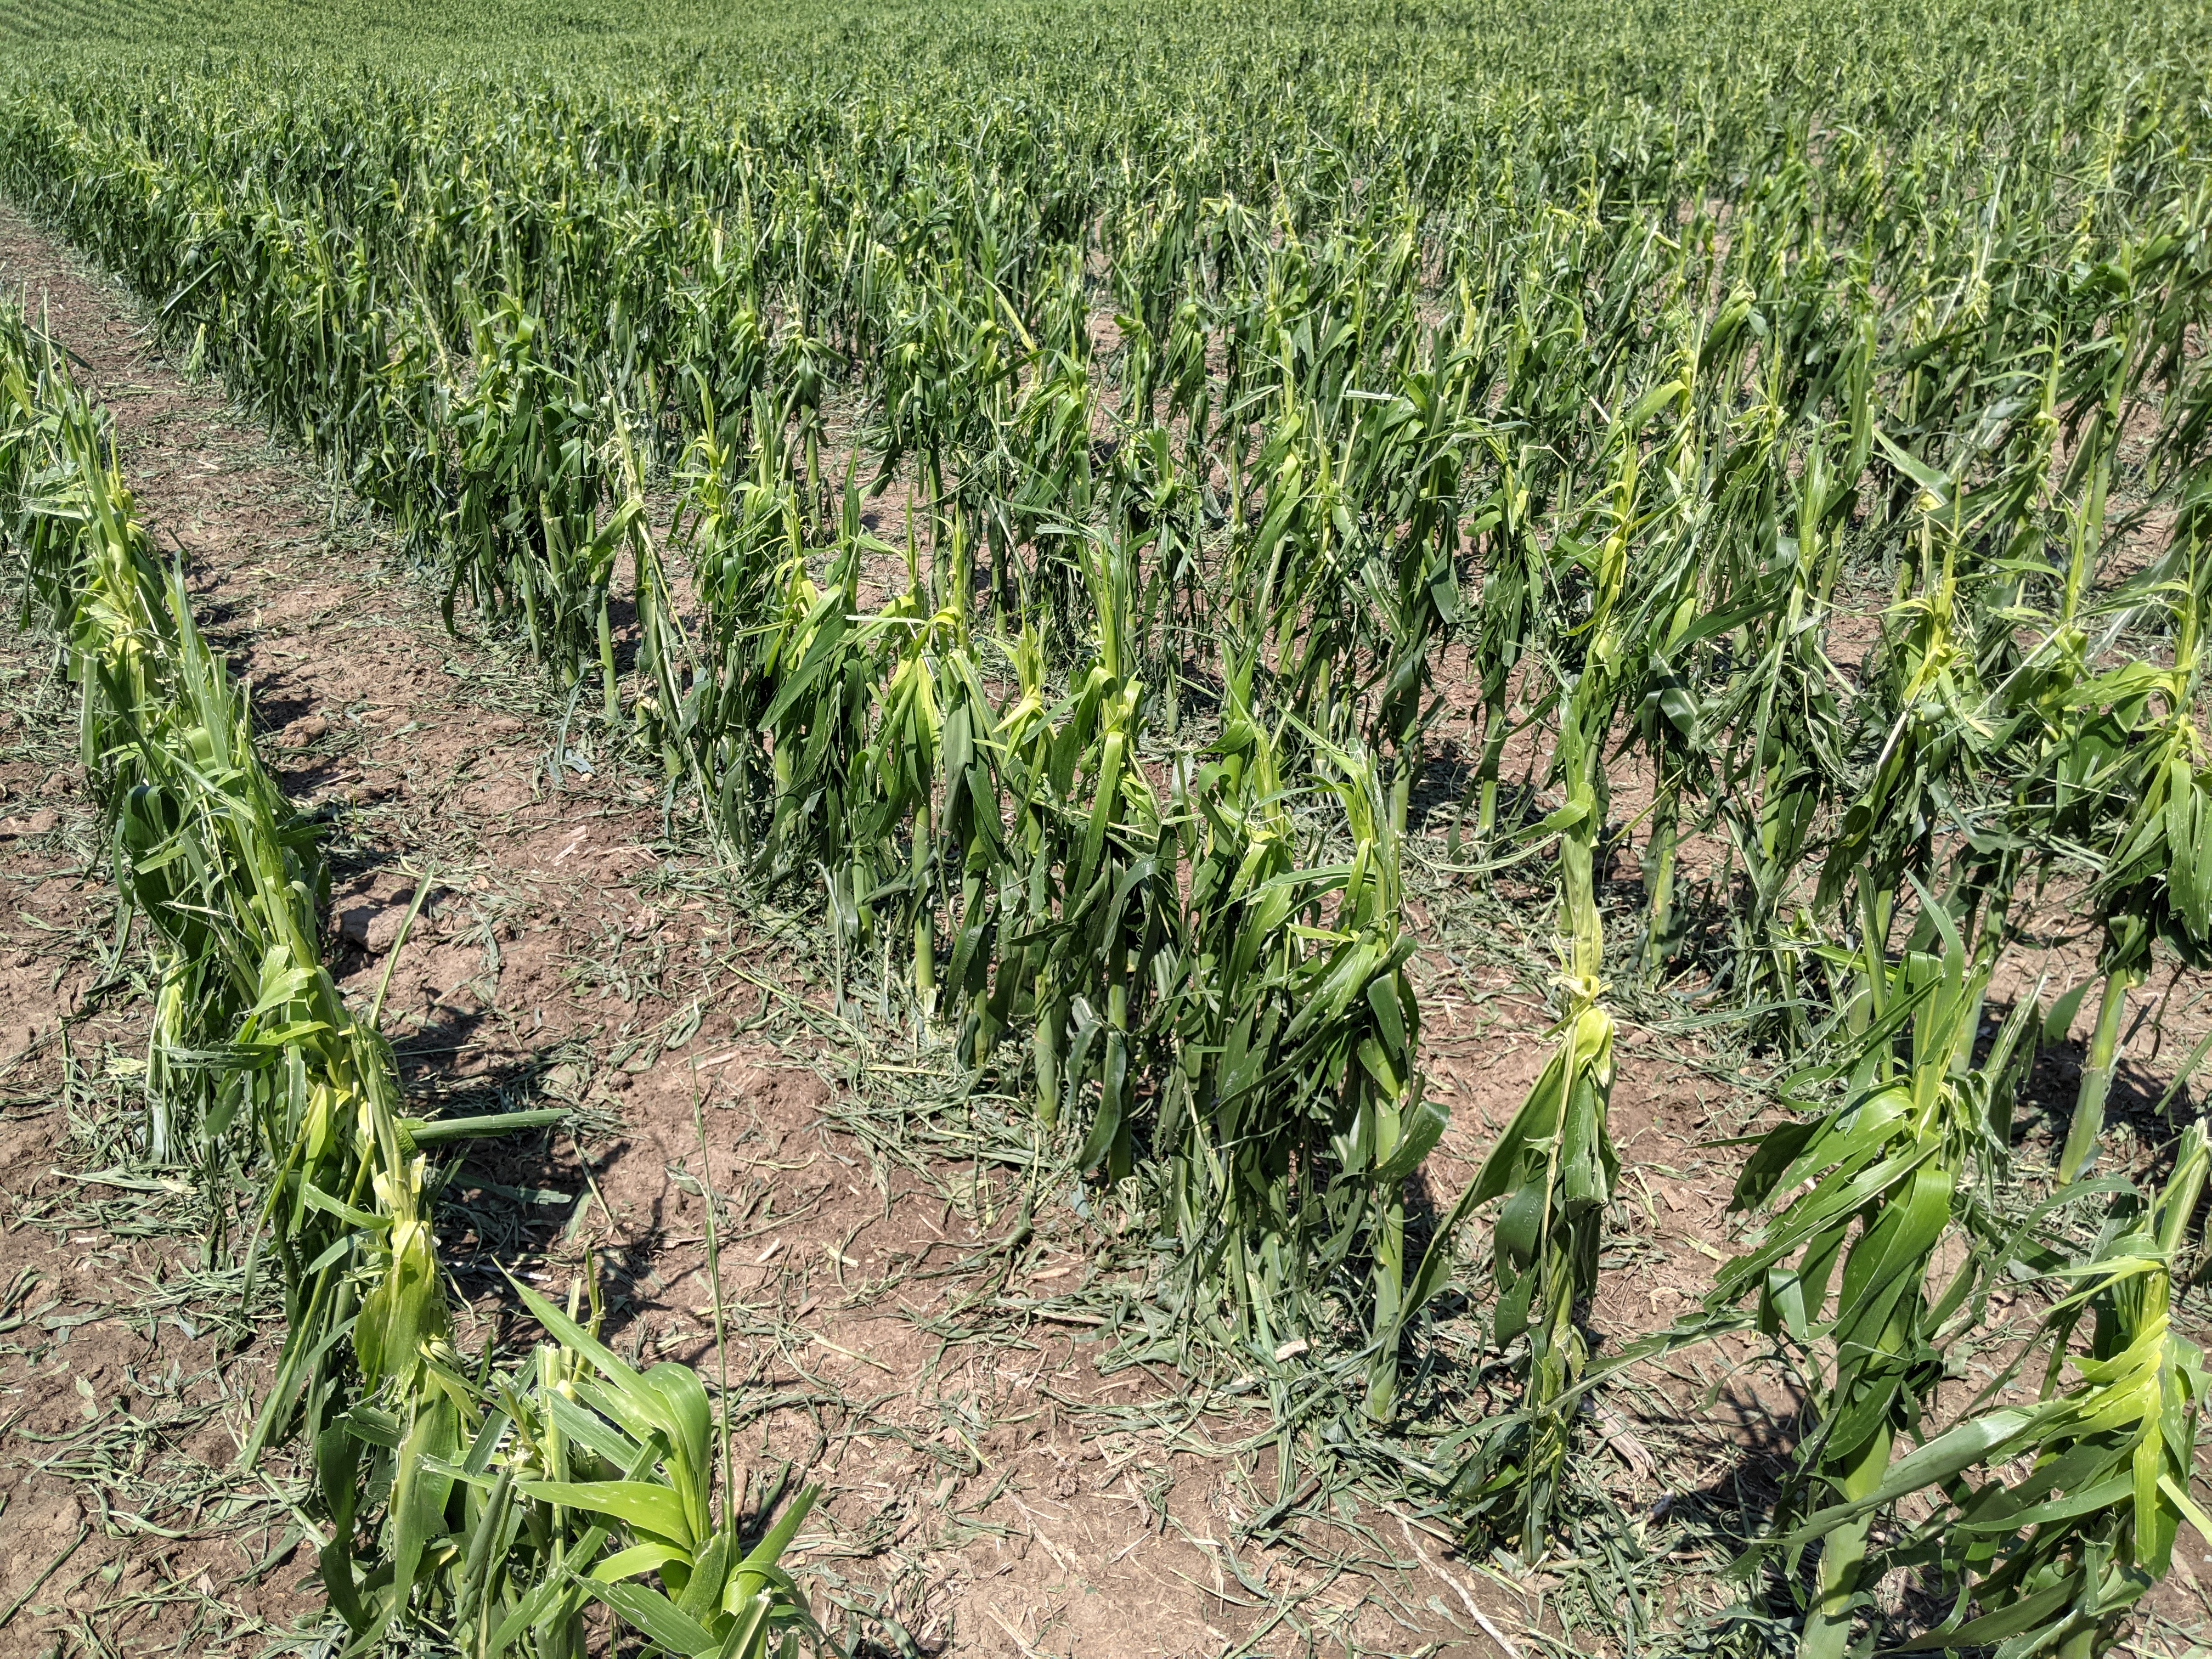
Crop Update: Overall, corn is looking really good with many fields around the 12 leaf stage. Soybeans were able to start growing again after some irrigation and rain. Also a note, the ET gage website is running again, so you can add ET info and view it again at: https://nawmn.unl.edu/. Grateful last Tuesday night’s storm didn’t do more widespread damage in the area than what it did! It looked pretty bad on radar, and in spite of the hail and wind, overall, many crops will recover and look a lot better in the next week. As the stripped leaves turn brown, there may be a brief point where the corn looks a little worse before more new growth shows up out of the whorl. Eventually it’ll look greener with more canopy again. Leaned plants are also righting themselves again.
It’s really hard to give a general summary as rain, hail, and wind has been so variable for the several county area. For this part of the State, crops north of Stromsburg and in the Hordville area got hit the hardest from what I’ve seen thus far. The key things to watch for in corn are stem bruising from the hail, stalk rot setting in, and rotted growing points. Some corn in the Hordville area that I looked at had deep stem bruising to the point the plants were broken off/breaking off near the ground in fields. Soybeans at the R1 stage in both areas were reduced to sticks in some fields. For fields that still have some leaves and some green to them, there are several criteria to look at when assessing hail damage to soybeans. These include determining plant stand, percent leaf defoliation, percent nodes cut off or broken over, and amount of stem damage. Determining percent leaf defoliation and subsequent yield reduction based on growth stage in indeterminate soybeans can be seen in the chart below. Hail damage charts show for R1 beans at 100% leaf loss, a 23% yield loss estimation (not including bruised stems, etc). I realize that’s really hard to accept with the way some fields look. The remaining charts can be found here. What has helped with all the hail and wind damage is the fact that we’ve had warmer temperatures to allow regrowth to immediately begin. There were new buds on soybean plants on Wednesday already and they were starting to flower again this weekend. However, that kind of loss to the canopy is difficult to recover from at R1 as weed control is also of concern. For alfalfa, watch for regrowth and so far, I’ve been seeing new growth. And, for wheat, it’s always tough to get hail so close to harvest as the grain shells out and heads break off.
| % Leaf Defoliation | |||||
| Growth Stage | 20% | 40% | 60% | 80% | 100% |
| % Yield Reduction | |||||
| V2 | 0 | 0 | 0 | 1 | 2 |
| V6 | 0 | 0 | 1 | 3 | 5 |
| R1 – R2 | 0 | 5 | 7 | 12 | 23 |
| R3 | 3 | 6 | 11 | 18 | 33 |
| R4 | 5 | 9 | 16 | 30 | 56 |
| R5 | 7 | 13 | 23 | 43 | 75 |
| R6 | 16 | 11 | 18 | 31 | 53 |
| R7 | 1 | 2 | 4 | 6 | 8 |
It will be important to work with your crop insurance adjusters as each field situation may vary. They will take stand counts and rate damage based on growth stage and percent of green leaf tissue (thus why they need to wait at least 7-10 days to determine new regrowth). Some have asked about the potential for replant options and/or forage crop options if the crop is totaled. First, you need to consider what herbicides were used. Second, for a corn situation, you need to consider if you want to go back in with corn, sorghum, or a forage crop (depending on what herbicides were used). We have such minimal data on short-season hybrids in the case of corn replant and yield. The UNL data that exists is from 1992 and it essentially says there’s yield potential for 100 bu/ac, depending on frost timing. Even though that’s old data, that’s consistent with information a Clay County farmer kindly shared with me regarding replanting corn in mid-July using 78 and 75 day relative maturity corn hybrids in 2018 and 2020. If you end up in a replant corn situation, I can share more specifics of his observations with you if you’d like to contact me.
If you find yourself in a soybean replant situation, make sure to add a seed treatment to replant soybeans as they have a high risk of seedling disease. Also, don’t plant a longer-season bean this late. I don’t know why that’s often recommended, but we would recommend going with a 2.0-2.5 maturity bean at this point in the season for our area of the State. If you drill the replant, be sure to increase seeding rate 10% (can go up to 20% for older drills) to account for the variability of seed spacing with the drill units. We often recommend increasing seeding rate by 10% for planted beans as well this late to aid in faster canopy closure. We share these tips in more detail with the research at: https://cropwatch.unl.edu/2019/strategies-delayed-soybean-planting.
Trees and Landscape Plants: Trees impacted by hail will often shoot new leaves for the leaves that were lost. It’s best to properly prune broken limbs back to the branch collar if at all possible to avoid disease setting into those limbs. You may also observe new buds occurring on shrubs, landscape plants, and garden plants, depending on how severely they were impacted.

Plants in this V10-11 field were shredded back to the growing point. In this case, the hail damage to stems was mostly on the outside surface of the plants.

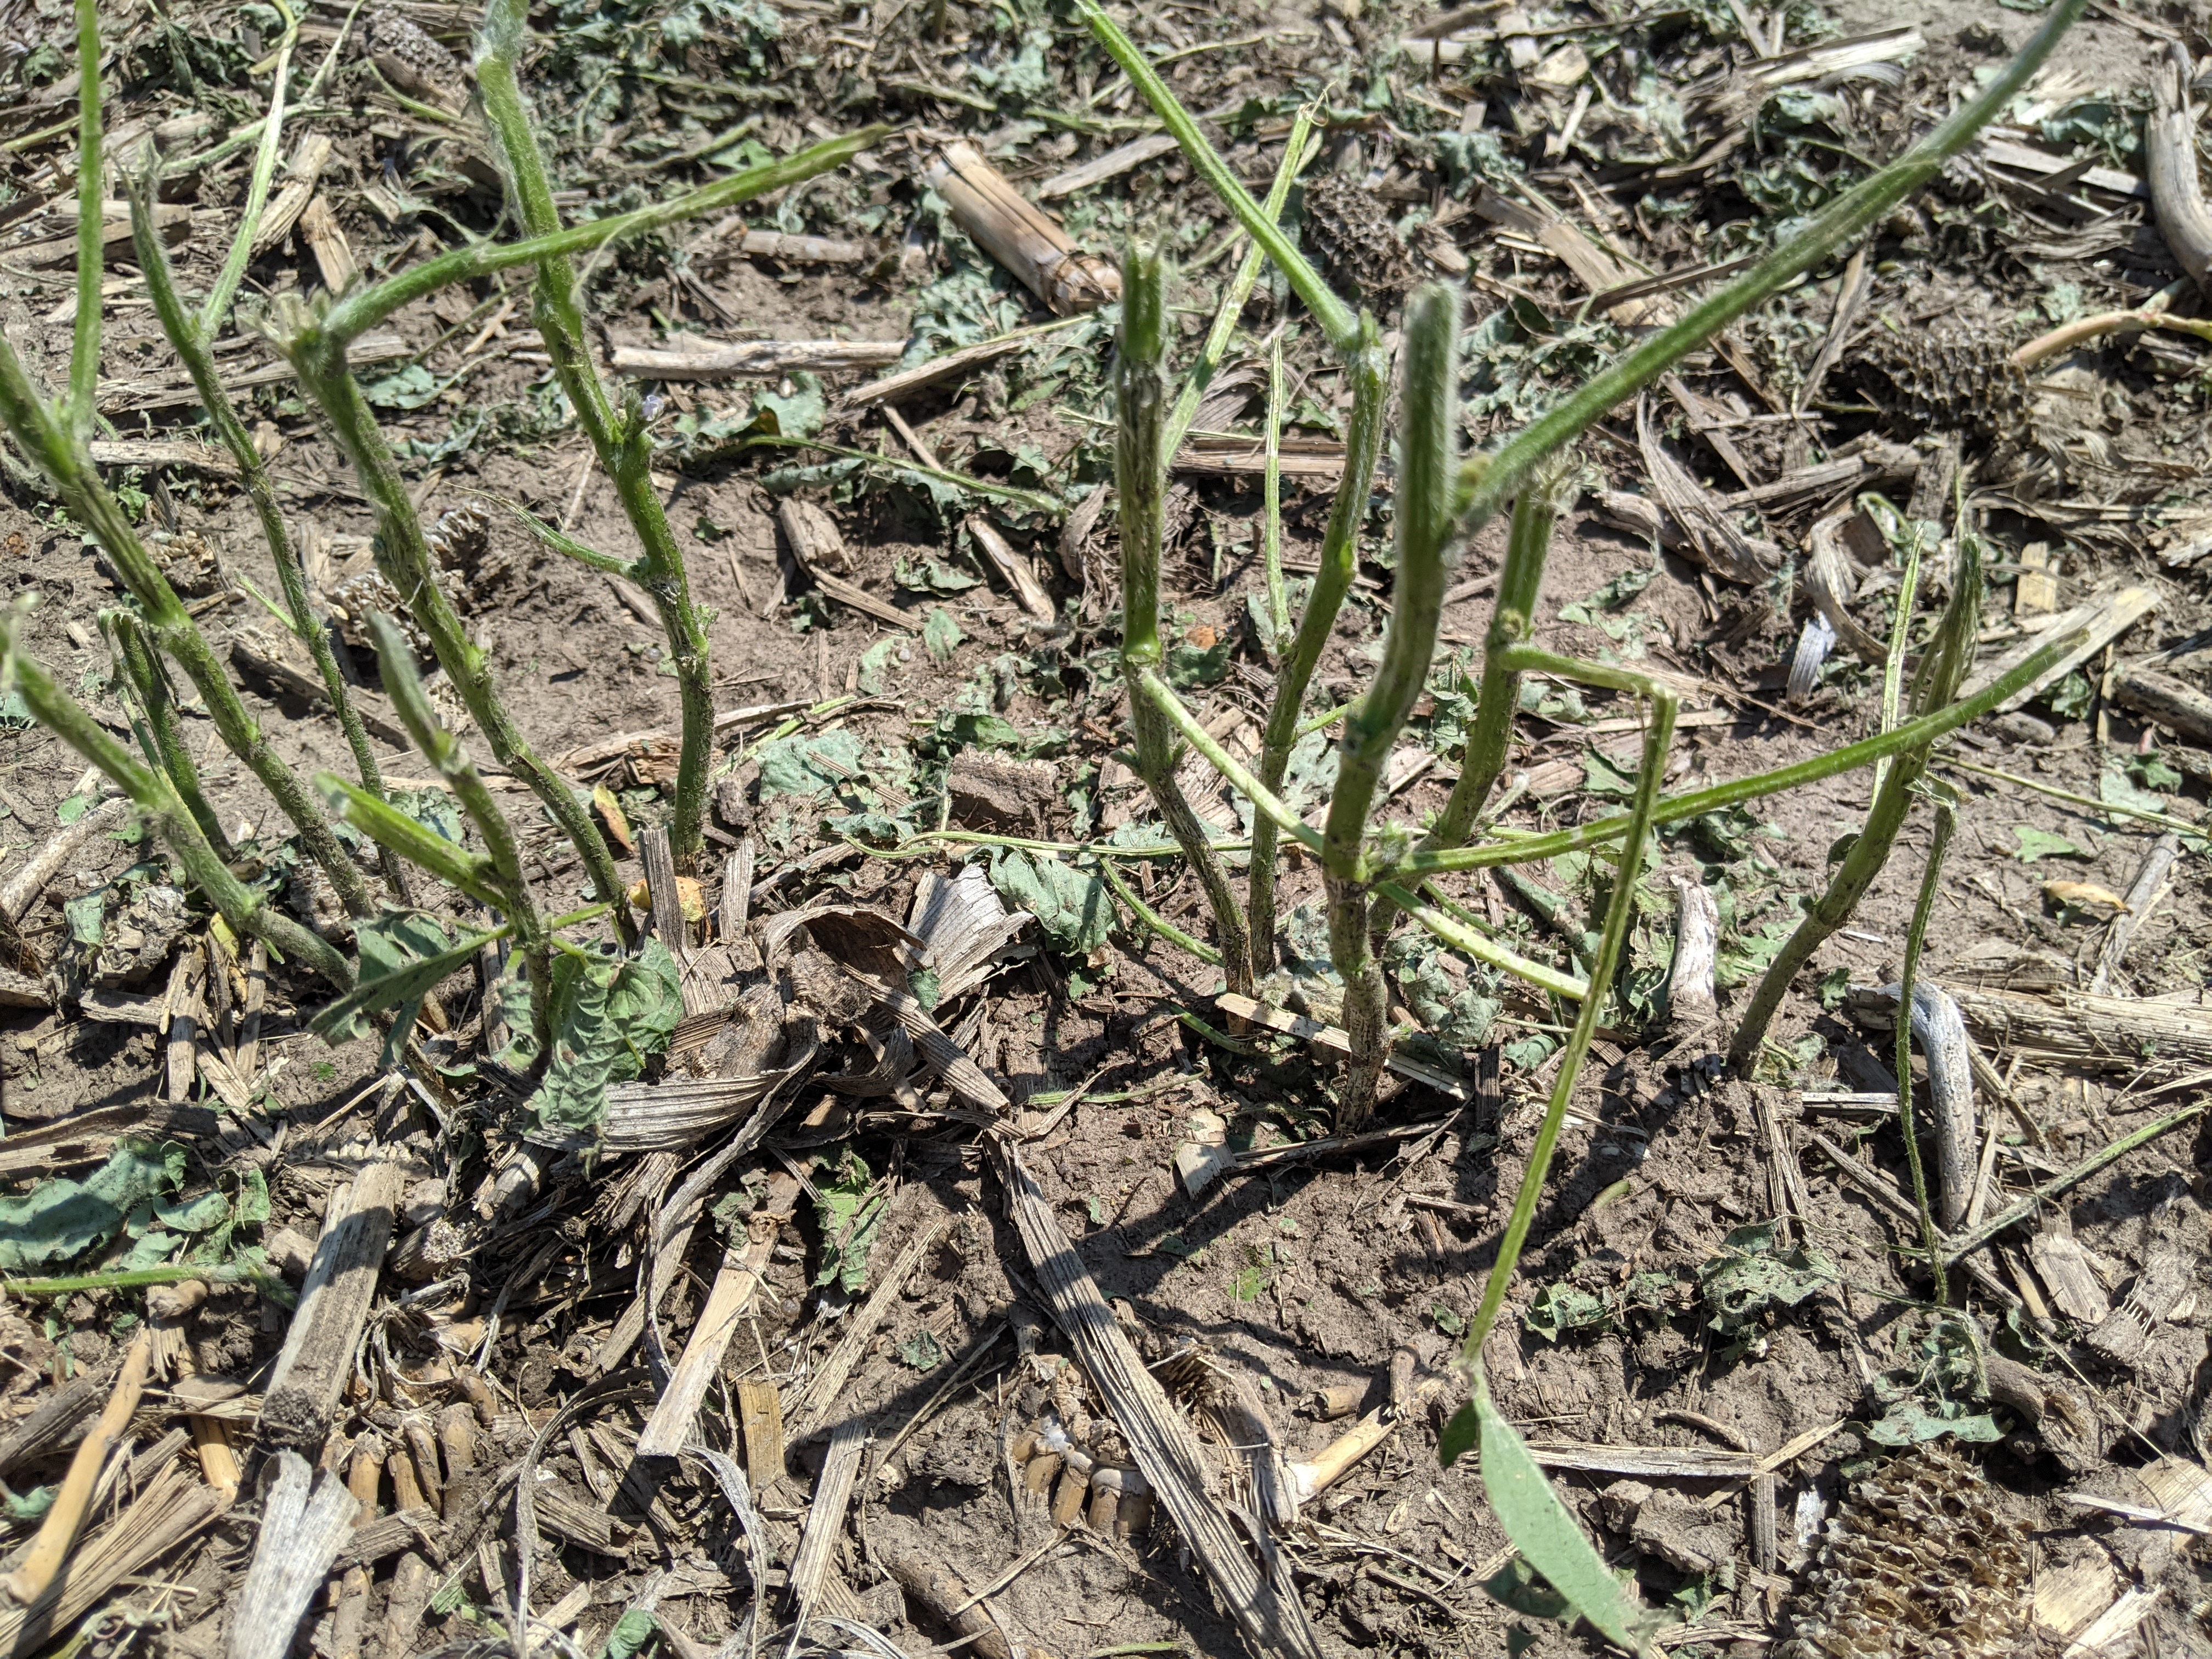


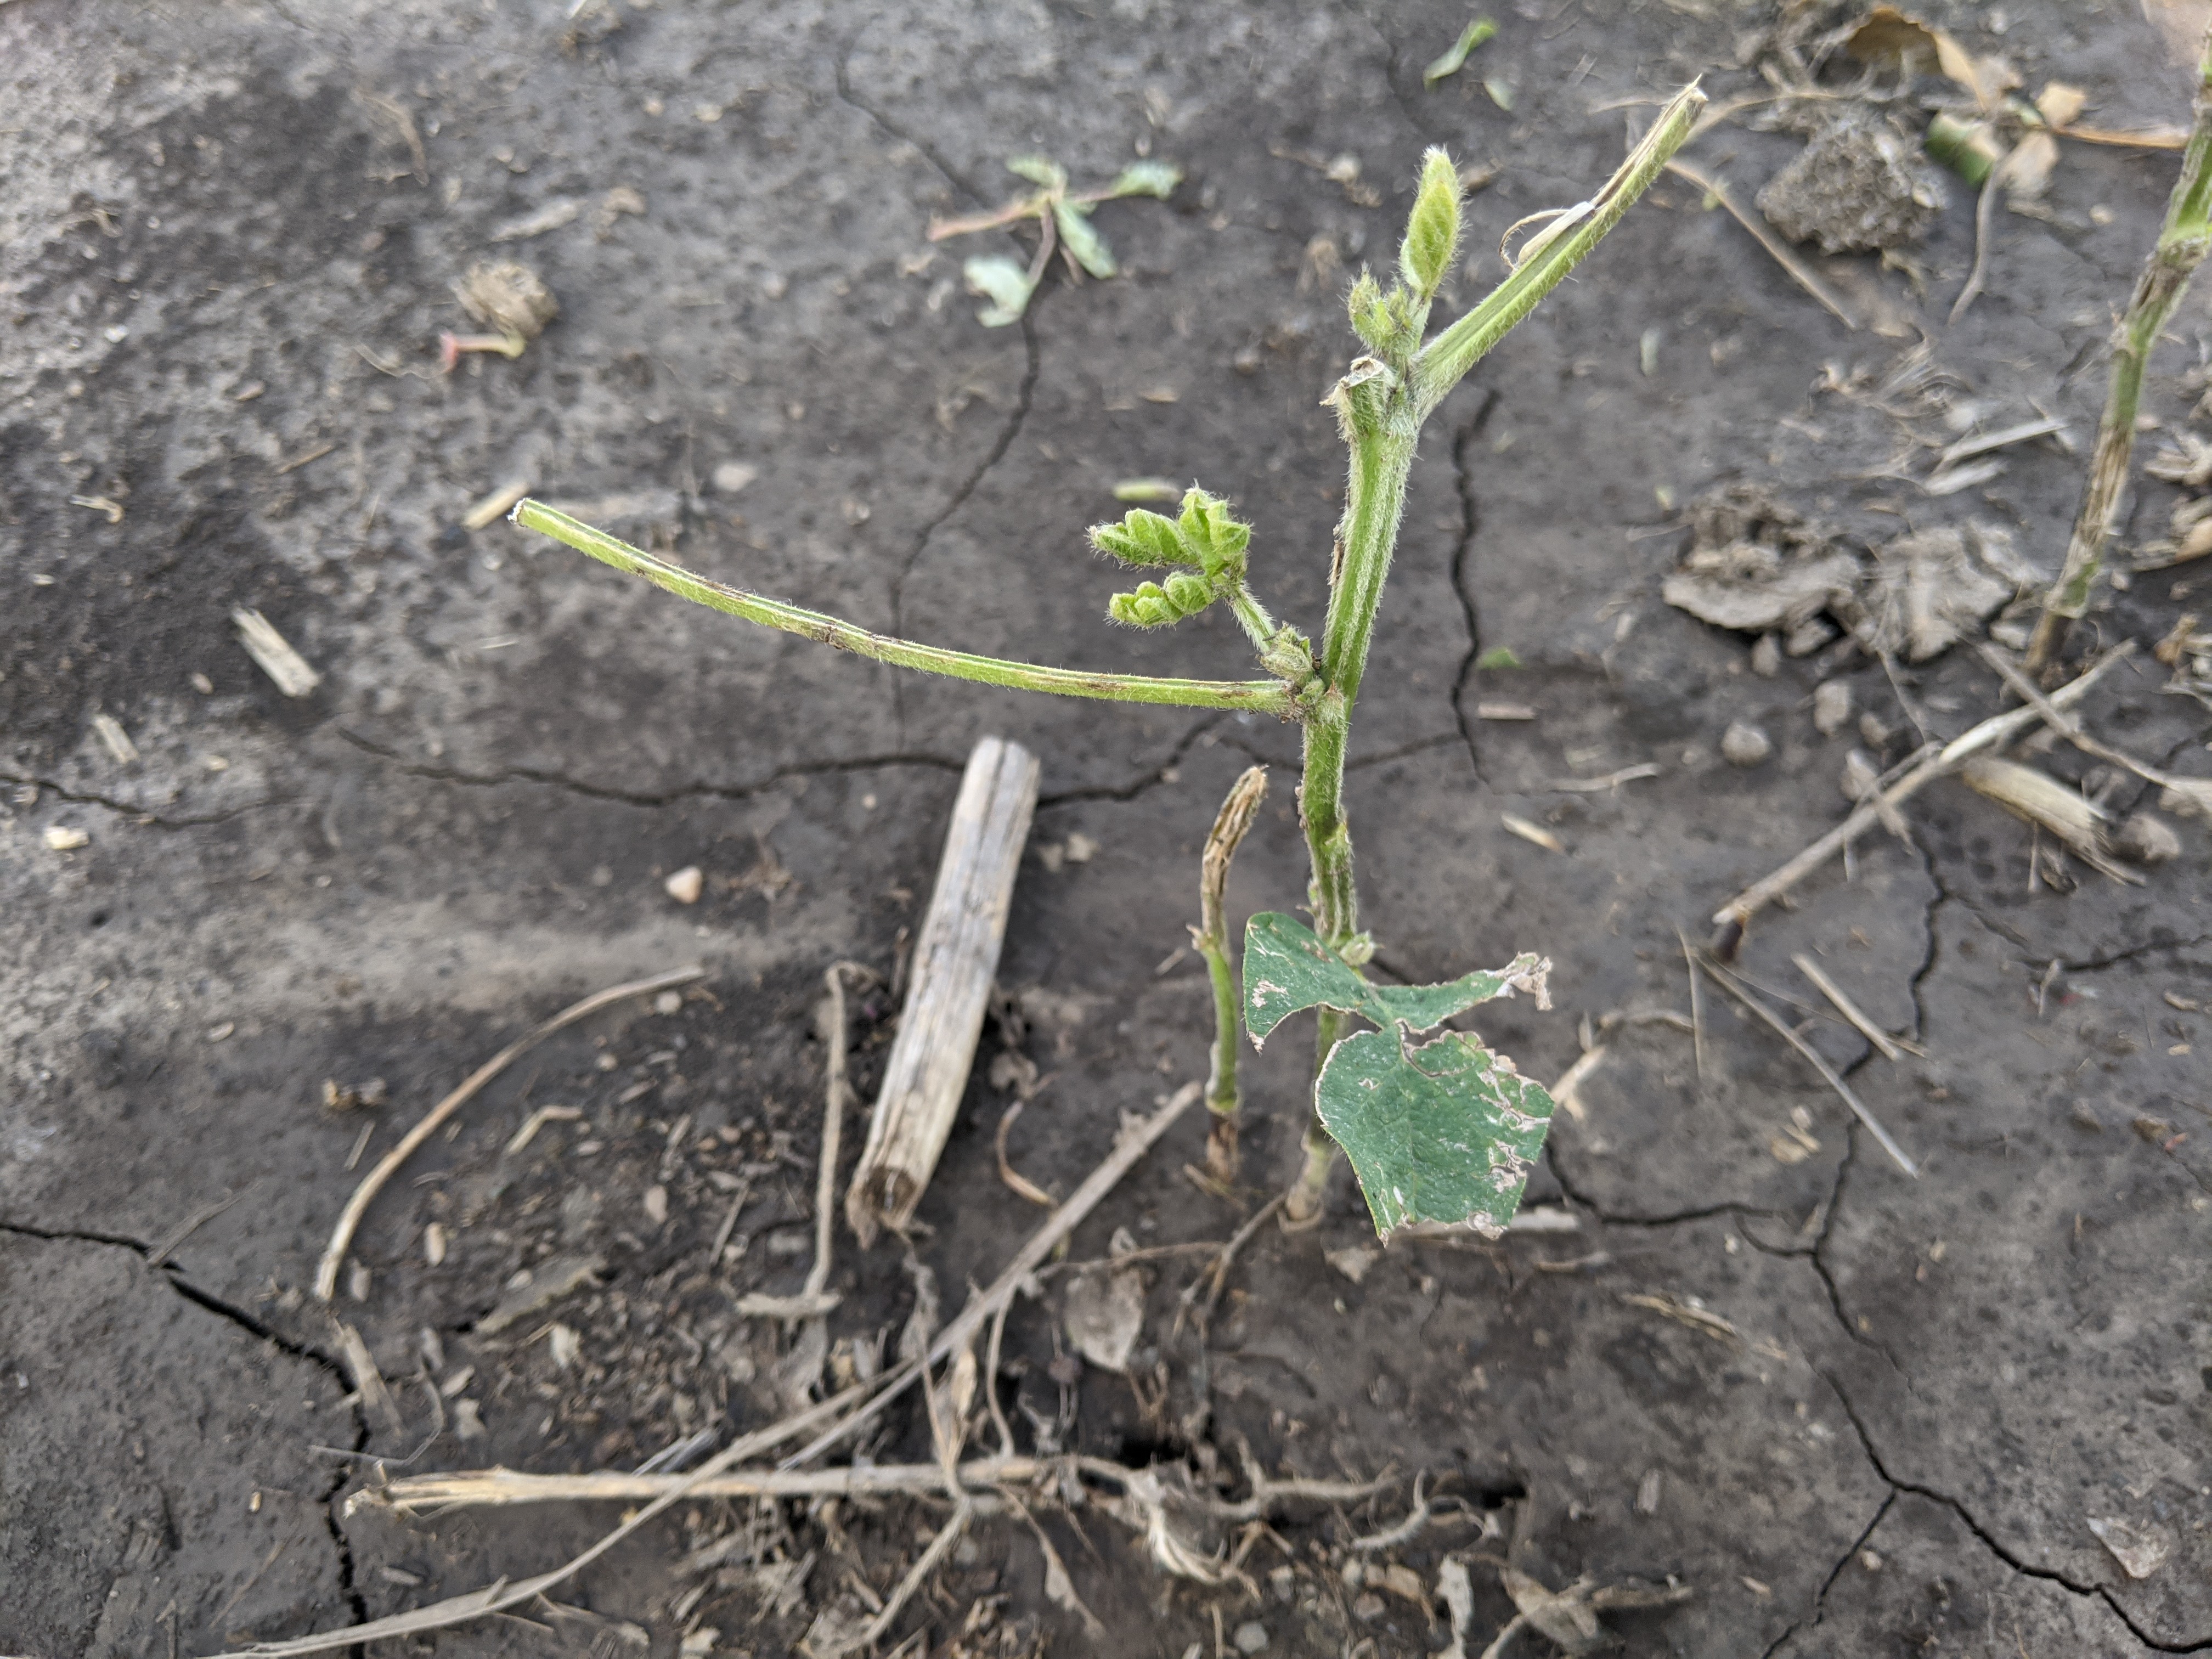
Same area of soybean field Wednesday afternoon (after previous night’s storm) and Sunday afternoon. Soybean reduced to sticks with new growth occurring Wednesday afternoon (first two pictures). New flowers occurring on soybean sticks and more growth observed Sunday afternoon (last two pictures).

JenREES 6/20/21
Crop Update: Last week was just a tough week for most I talked with between the heat, irrigation starting, and the various problems observed in fields. Incredible the temperature swings in 4 months with the record lows in February and record highs in June! Installed moisture sensors most of the week and didn’t find a lot of moisture in the top 18” in most area fields. We don’t like irrigating soybean this early due to potential disease issues and lodging. I was recommending it too for herbicide activation and to get soybeans growing again after various issues with herbicide carryover, off-target movement, flaming, etc. observed this past week. But soybean won’t need to continue being irrigated depending on soil moisture and rooting depth. Hopefully they will grow and we can get to canopy soon.
Early Season Interseeded Cover Crop Driving Tour June 29 will provide an opportunity for interested individuals to view interseeded fields at a location closest to them or to view as many locations as they would like. No charge. RSVP is only required for those desiring a boxed lunch; please RSVP for lunch at (402) 362-5508. The boxed lunch is sponsored by The Nature Conservancy and it will be located at the Upper Big Blue NRD (UBBNRD) in York. There will be no restrooms at the field locations; restrooms can be used at convenience stores along the tour route or at the UBBNRD. Viewing of the fields will occur only at the times listed to allow for the cooperators to tour the other locations. Grateful to these cooperators for conducting these interseeding studies! Questions: Jenny Rees (402) 440-4739 or Nelson Winkel (308) 833-0487.
- 8:45-10:00 a.m. Clay Co. (Chad Dane, Harvard, 30” corn and soybean, Begin at Corn: ½ mile north intersection HWY 6 and Road K, east side of road, Soybean: ½ mile south intersection Rd 319 and Rd O, west side of road)
- 10:40-11:15 a.m. Hamilton Co. (Brandon and Zach Hunnicutt, Giltner, 30” corn, ¼ mile north intersection of 6 Rd and G Rd, west side of road)
- 11:45 a.m.-12:30 p.m. York Co. (Jay Goertzen, 36” corn, 1008 Rd D Henderson, on home place and view his interseeder)
- 12:50-1:30 p.m. (Upper Big Blue NRD, 319 E. 25th St, York) Restrooms & Boxed lunch (Lunch RSVP required at (402) 362-5508), View interseeder
- 2:00-2:30 p.m. Seward Co. (Mark Schlechte, 30” corn, 1 mile north intersection HWY 34 and Road 406, meet at bin site)
- 3:00-3:30 p.m. Seward Co. (Lyle Hamling, Beaver Crossing, 15” soybean, ½ mile south intersection of Denton Rd and 364 Rd, drive onto place on west side)
Ornamental Evergreens: Looked at and received a number of calls regarding ornamental evergreens such as the ‘Fat Albert’ varieties turning brown/purple/pink on the south sides. Winter injury is showing up on them. All the trees I looked at had had heavy spidermite pressure at one time as well. The spidermites may have been a secondary problem with the additional tree stress. Fortunately, most trees I looked at had new buds appearing on twig tips. The discolored and dead needles won’t be replaced. For these small trees/bushes, you can use heavy streams of water to remove spidermites that are still active on trees. Watering (but not overwatering) can also help with their recovery.
Vegetable Gardens: Also received a number of garden questions. Seeing a lot of scorch due to heat, overhead watering in the heat (try to water at base of plants), and leaf curling due to uneven watering.

JenREES 6/13/21

The linden trees are in full bloom and their fragrance is incredible!!! Last week I was out of the office with family, so didn’t get to check fields but heard from some of you who provided me updates on what you’re seeing. Corn is rapidly growing and closing the canopy. A few have reported early planted soybeans are already flowering. The corn planted into cereal rye looks more yellow right now, which is to be expected with the nitrogen being tied up by the rye. It should start releasing the nitrogen shortly. I realize it doesn’t always look as good right now; my experience has been that it will turn around come July and hopefully that continues to be the case.
With the post- herbicide applications being made, have heard/seen comments about waterhemp/palmer in fields with corn or soybean planted into rye. There is no silver bullet for weed control and cover crops aren’t one either, but they do greatly help in weed suppression and are another tool in our toolbox for a system’s approach. In previous weeks of walking fields, waterhemp and palmer tended to appear in areas where rye was thin and in endrows, otherwise the fields were fairly clean. In many green-planted soybeans, the rye formed a really nice mat to suppress weeds. Also, each field situation can be different. Some growers did a second pass with their residual after killing the rye. It stinks to do this but some have had more success in waiting to apply residual to better allow it to get down to the soil. Some added their residual to the burndown on tall rye (greater than 12-18”) and, depending on the product and its water solubility, the product may not have gotten to the soil yet. With this second scenario, there’s also differences when some used more water-soluble products, or applied prior to a good rain/applied irrigation, as these seemed to have better results with their residual products.
It has been hot, but it’s also been very humid, so crops aren’t using as much water as one thinks. That’s where having an ET gage or viewing ET information can be helpful. The CropWatch website is one resource for this information at: https://cropwatch.unl.edu/et_resources.
There’s also been concern about weather conditions and potential for temperature inversions. Al Dutcher shared the following, “If skies are clear and there is no wind at sunrise, it is a guarantee that an inversion is in place. Dew formation is another tell-tale sign (although during droughts dew may not form). When the high pressure is directly overhead, the inversion can last up to 4 hours depending on time of the year. During the summer it is lessened due to intense solar radiation early in the morning as compared to April and early May. Operators should be taking a temperature measurement at canopy height and at least 8 feet in the air to see if the inversion is still in place at the surface. A smoke bomb serves as a secondary control as the inversion may have lifted at the surface, but still exists above 8 feet (happens a lot in river valleys). The smoke bomb will rise up and if an inversion layer still exists higher up, the smoke will flatten out and drift sideways. If no inversion exists, the smoke will rise up and dissipate with height.” A great resource on temperature inversions from North Dakota State can be downloaded as a PDF here: https://www.ag.ndsu.edu/publications/crops/air-temperature-inversions-causes-characteristics-and-potential-effects-on-pesticide-spray-drift.
Light Trap Data for four Nebraska locations can be viewed at: https://entomology.unl.edu/fldcrops/lightrap.
Interseeded Cover Crop Driving Tour: If you’re interested in what we’ve been doing with interseeding cover crops into corn and soybeans, please save June 29th for a driving tour of some on-farm research fields! We’ll begin in Clay County and move to Hamilton, York, then Seward counties. I will share details next week. Essentially, I will provide the start time we’ll be at each field and you’re welcome to meet us there for one location or as many as you’d like. We’ll only plan on being at each location for 30-45 min. before moving to the next one. Will provide time for people to grab some lunch wherever you prefer in York before hitting the Seward county fields.

End of news column.
For fun: for those who have followed me a long time and/or know me/my family better, I arrived at the farm last Sunday afternoon to a 16 person water fight; also had another precious niece arrive this past week 🙂 May we enjoy our families and take time for these moments in our lives as time goes so quickly!

JenRees 6/6/21
Grateful for the nice weather last week for post-emergence spraying! As crops continue to rapidly grow, a reminder for proper growth staging using the leaf collar method. A collar develops at the leaf base near the stalk after each leaf fully expands. Think about collars like the collar on a button-down shirt. The collar flares slightly at one’s neck, just as a true exposed leaf collar flares at the base of the leaf at the stem. Start counting leaves at the base of the plant with the smallest rounded-tip leaf with a collar as #1. From there count every leaf with a true collar. Leaves that are still wrapped in the whorl around the main stem without exposed leaf collars are not counted. You can also paint a certain leaf of the plant, such as V5 or V6, inside the field (not endrows), so you can continue to count leaf collars as the lower leaves start to slough off.

It may also be helpful to get irrigation scheduling equipment installed soon. For those with watermark sensors, we’d recommend to soak the sensors in water for 24 hours and then read them to make sure they’re under 10 kilopascals. Then allow them to dry out to 199. Before installing, soak again (but only needs to be like 5 min.), and they should still read less than 10 kpa before installing. Last year I made a video regarding installation if it can help (https://youtu.be/4r5gn2pvvB4). For those looking for telemetry options, there are options available for watermark sensors too. One option from Servi-Tech is called the Profiler through their STEPS program. Another option is from Irrometer who makes watermark sensors. For those who use ET gages, remember to use distilled water when filling the main column, prime the small tube with the stopper and ensure there’s no air bubbles, and remember to fill the ceramic top with water before adding the stopper. With Dr. Suat Irmak’s departure from UNL to Penn State, the ET gage site has been decommissioned. ET information can also be found at UNL’s CropWatch website at: https://cropwatch.unl.edu/et_resources.
Weed Management Field Day: Growers, crop consultants and educators are encouraged to attend Nebraska Extension’s Weed Management Field Day from 9 a.m. to 1 p.m. June 23, 2021 at the South Central Agricultural Laboratory near Clay Center. The field day will include on-site demonstrations of new technology and new herbicides for corn, soybean, sorghum, and sweet corn. An early morning tour will focus on weed management in soybean and sorghum followed by a tour of weed management in field corn and sweet corn. Field experiments will provide information for weed control options with various herbicide programs. Three Certified Crop Advisor (CCA) Continuing Education Units are available in the integrated pest management category. There is no cost to attend the field day, but participants are asked to preregister at http://agronomy.unl.edu/fieldday. The South Central Agricultural Laboratory is five miles west of the intersection of Highways 14 and 6, or 13 miles east of Hastings on Highway 6. GPS coordinates for the field day site are 40.57539, -98.13776.
Bagworms: Have received a few questions regarding if bagworms have emerged yet. The very cold winter hopefully may have impacted bagworm survival since they weren’t as insulated on trees. I haven’t checked trees yet, but here’s a trick to help know. If you have last year’s bags on your trees that are sealed (don’t have an open hole at the top), you can pick off some bags, place them in a ziplock bag, and place it outdoors on the south side of your house. When/if you see larvae emerge, it’s a good indication to start checking your trees in the next weeks. The larvae are really small and hard to see. Stand still and watch the tree. If bagworm larvae are present, you will see very tiny movements as they begin the process of building new bags. I have pictures and a video at: https://jenreesources.com/2015/06/27/bagworms-in-evergreens/. For more info., please see: https://go.unl.edu/rgju.
JenREES 5/30/21
Driving to look at some on-farm research fields in Seward county last week, I came over the hill to see the flags lining Highway 34 at the cemetery. This time of year, when flags are set out lining streets in towns and at cemeteries, never ceases to get me. In that moment, with chills and tears, I said a prayer of gratitude for our Country, for our beautiful flag, for our freedoms and those who gave all for my freedom, and for living in this great Country. In spite of everything going on in the world, and in spite of how differently people view freedom and what’s happening, we still are so blessed to live in this Country! Many service members recall their battle buddies who never came home with them. Many military families throughout history have walked alongside the families left behind. Freedom truly is not free! So this Memorial Day, may we remember and be grateful for those who paid the ultimate sacrifice for our freedom, may we remember and be grateful to those families left behind, and may we keep praying for our Country and leaders, military members and their families.
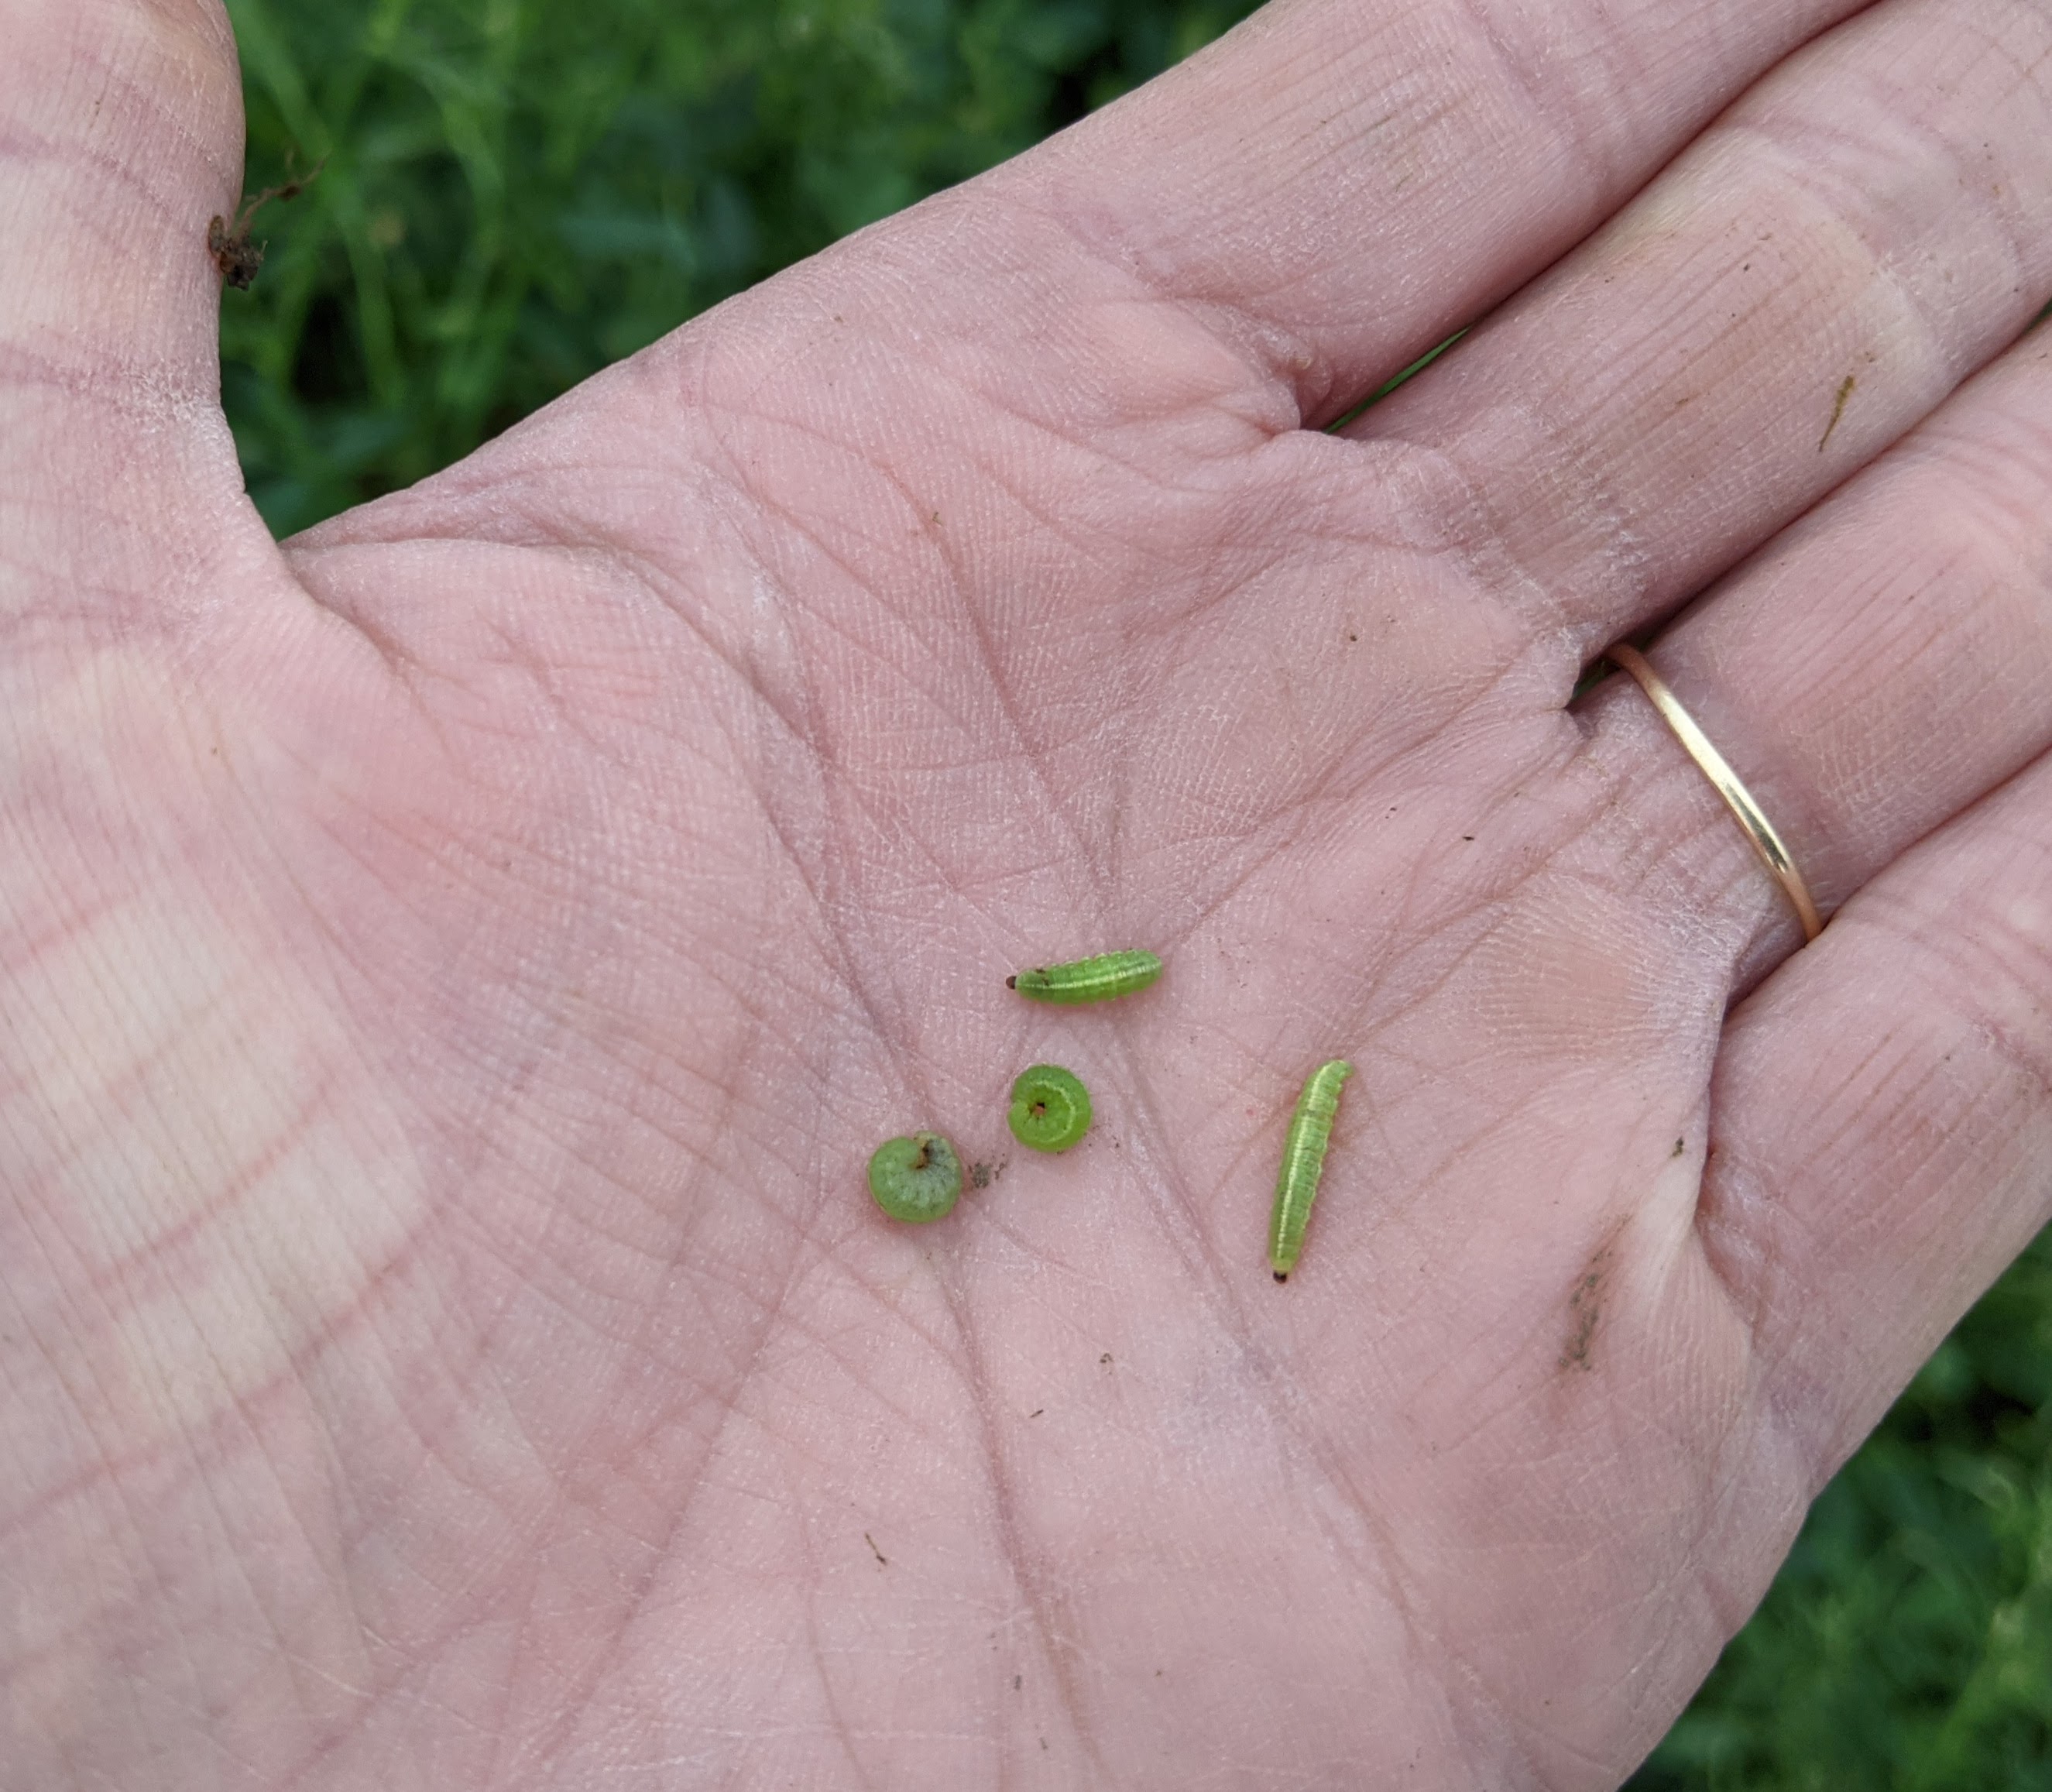
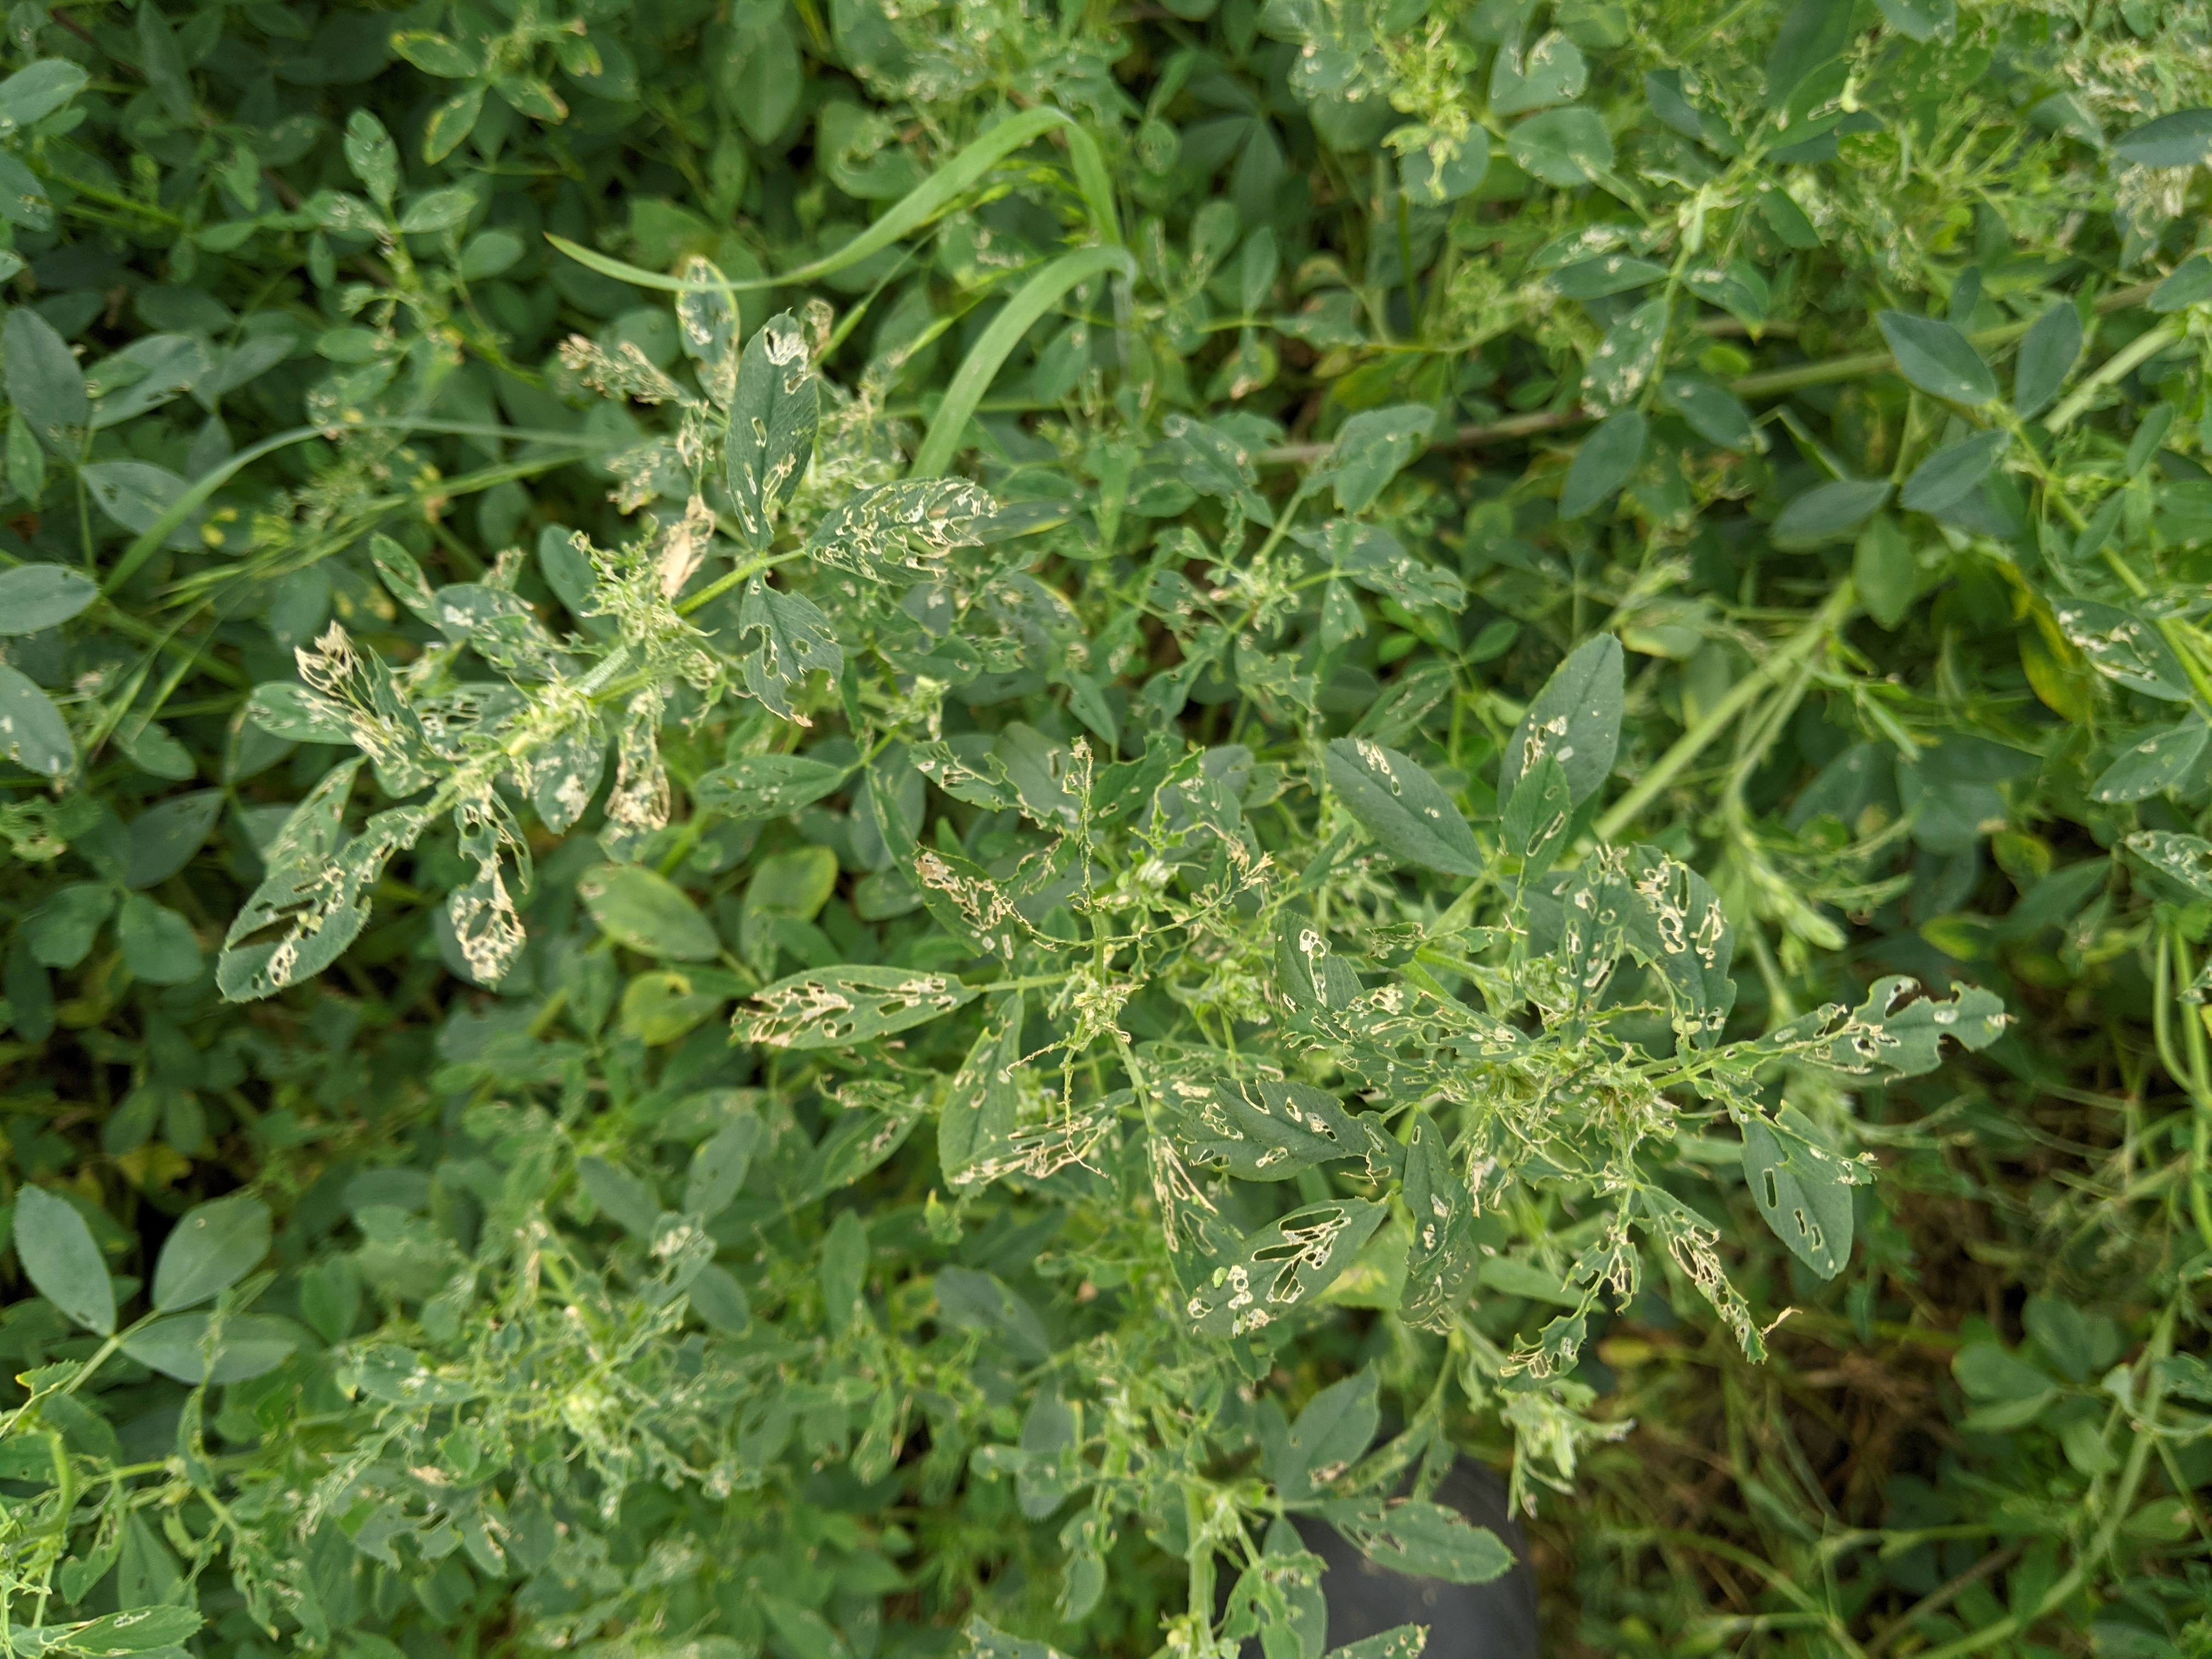
Alfalfa weevils have been heavy this year. For those with alfalfa, you may have noticed the tops of your plants turning a grayish/brown color. The culprit is most likely alfalfa weevil larvae. They are green caterpillars with a white stripe down the back and dark head. They are often hard to find as they will go down to the crowns of plants in heat of day. By the time you read this, the alfalfa will most likely be put down. What you may observe: once the alfalfa is put down, the weevil larvae will continue to feed. The area under the windrows will turn brown as they feed on the regrowth. As soon as the alfalfa is baled, we’d recommend using an insecticide to kill the larvae and allow the alfalfa to regrow. I’m still seeing all stages of larvae in the field. Highly effective insecticides for alfalfa weevil control include those that are pyrethroids (active ingredient ends in “thrin”, such as Permethrin) and products containing indoxacarb (e.g., Steward). Each field situation may be different, though, so watch the regrowth. If it’s greening up and you’re not finding weevil larvae, they may have pupated and treatment may not be necessary.
Nebraska Land Link provides opportunities to connect land seekers with retiring landowners. Land access is one of the biggest challenges facing aspiring and beginning farmers. For some landowners, they simply do not have the next generation available to take over their operation. Nebraska Land Link is a project of Nebraska Extension’s Farm and Ranch Succession and Transition program and Nebraska Women in Agriculture. When you apply to Nebraska Land Link, either as a land seeker or a landowner, Nebraska Extension personnel will work to match your application with the most compatible counterpart. Using the answers you submit and offer in a potential interview, Nebraska Land Link matches are based on the shared values, interests and skills of both parties, so that a mutually beneficial and satisfying partnership can be forged over the course of the transition plan. You can learn more about the program at: https://farm.unl.edu/landlink and watch a short 3 minute introductory video at: https://go.unl.edu/8sv6.
Ash Trees Losing Leaves: The past few weeks I’ve received questions about ash trees losing leaves. Because of the weather conditions, anthracnose on shade trees, including ash, is fairly prevalent. It’s crazy how I didn’t take any pictures when looking at any of these trees…but what you will see are small dark spots on the leaves. The leaves may curl and turn yellow-green in color before dropping. There’s nothing you should do and a new flush of leaves will appear in time.
York Co. Progressive Ag Safety Day has been postponed to June 14, 2022.
Dealing with Conflict Dynamics for Farm and Ranch Families Course: Conflict and tension often arise in family farms and ranches. This new course strives to provide Nebraskans with tools to build a better culture. Participants will gain the skills and resources necessary to overcome the conflict that may be hampering their family and business relationships. The course will be taught by renowned farm family coach Elaine Froese and hosted by Nebraska Extension’s Women in Agriculture Program. The Conflict Dynamics Training is a three-part course that will be held virtually from 3:30 to 5 p.m. Central time on June 15, 22 and 29, via Zoom. An internet connection is required, and participants should plan on attending all three sessions. Participants in this course will take a Conflict Dynamics Profile assessment to measure their personal conflict behaviors. The profile will help participants understand how they respond to conflict, what triggers can escalate conflict and how to manage conflict more effectively. Froese will then guide participants through a discussion on how to deal with conflict and tension on the family farm or ranch. The course fee is $35 per participant and the class size is limited to 20 people. Registration closes June 11. Because of the sensitive nature of the course, it will not be recorded. Registration is open at https://wia.unl.edu/conflict-dynamics.


JenREES 5/23/21
Crop Update: Grateful for when the rains were light to break crust and grateful for sunshine this weekend! Hoping weather works out for those who need to finish up planting! For those whose beans were further along, have received comments about crusted soils and lower soybean populations. A general guideline is to leave a field alone if plant populations are greater than 50,000 plants per acre, the stand is fairly uniform, and the field can be kept fairly weed free. I don’t have research going down to 50K, just observation. As you assess plant stands, keep in mind that a gap in one plant row will be compensated by plants in the adjacent flanking rows. They will form extra branches to take advantage of the sunlight. Thus single-row gaps may not be as yield-reducing as you might think, especially in narrower row spacings.
Soybeans greatly compensate for reduced populations by increasing branching. Nebraska On-Farm Research from eastern Nebraska and western Nebraska from 2006-2018 showed only a 1.3 bu/ac yield increase when seeding 180,000 soybean seeds/acre compared to 90,000 seeds/acre in 15-inch or 30-inch rows. (No studies were in sandy soils). Average final plant stands became 154,924 vs. 83,067 plants per acre respectively. Specific examples with lower final plant stands follow:
- A non-irrigated field in Nuckolls County in 2006 was hailed at the cotyledon stage, so planted populations of 100K, 130K, and 160K became average actual stands of 74,417; 89,417; and 97,917 plants per acre with a 4 bu/ac yield difference between highest and lowest plant populations. The average yield in the field was 40 bu/ac.
- A York County irrigated field in 2018 comparing 90K, 120K, and 150K became final plant stands of 60,875, 88,125, and 121,750 plants/acre with yields of 93, 94, and 97 bu/ac respectively.
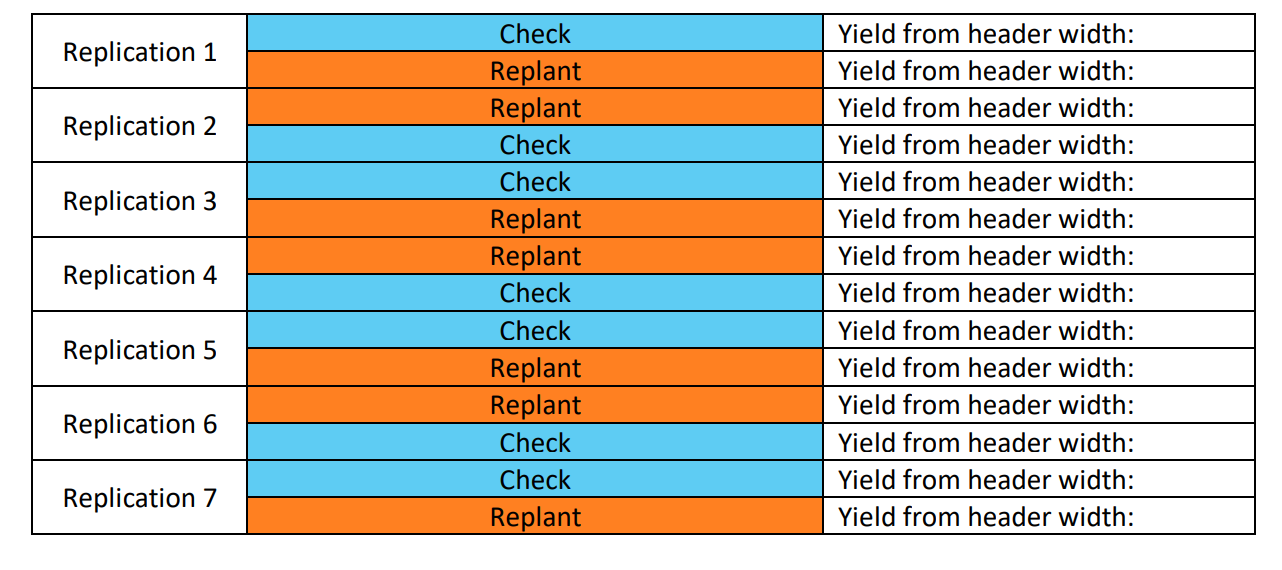
Every challenge also provides opportunities for learning. So, if you consider replanting, consider leaving some check strips and/or consider an on-farm research study. To do this, consider:
replanting 2 combine widths, skipping 2 combine widths, replanting 2 combine widths, skipping 2 combine widths, replanting 2 combine widths.
It’d be great if you could do that even more often across the field, but just that pattern mentioned above will give you 4 reps that would give you more confidence in the yield results obtained. A Platte County grower did this in 2014. He originally planted 145,000 seeds/acre on May 10 no-till into heavy corn residue. With a plant stand of 75,000 plants per acre, he chose to replant soybeans in strips across the field. He left the original stand and planted an additional 145,000 seeds/acre. Final yields were 58 and 57 bu/ac for the original and replanted stand, respectively. Please let me know if this is something you’re interested in and I’d be happy to help you.
Weed Guide Survey: The Weed Guide has been published since 1960 with over 15,000 copies printed each of the past 5 years. Please consider completing a survey to help us understand the latest trends on how our customers use the weed guide and its value to you: https://ssp.qualtrics.com/jfe/form/SV_1ImdUrOCRmUq9Uy. We really do need and value your input!
Progressive Ag Safety Day June 3: This is a fun-filled day of learning for school-aged children and will be held at the York County Fairgrounds from 8:30 a.m.-1:00 p.m. on June 3. Topics for demonstrations and discussions include: Electrical Safety, Pipeline-Gas Safety, Grain Safety, ATV/UTV Safety, Look-a-Likes, Power Tool Safety, Equipment Safety, and Internet Safety. The registration fee is $5.00. This safety day includes lunch, snacks, a T-shirt, and a take-home “goody” bag. Register with the York County Extension office (402-362-5508). Registration is due by May 25th to ensure a t-shirt and take-home bag; however, please do sign up even after May 25th if you read this after the date! We’d rather have the youth get signed up as this is a great learning opportunity! Contact the York County Extension Office (402-362-5508) or Jason Perdue (402-366-2821) for additional information. We hope to see lots of youth there!

Corn Emergence and Growing Degree Days
Corn Emergence and Growing Degree Days: For this week’s column, I’m going to share information my colleague, Nathan Mueller, Extension Educator in Saline, Gage, and Jefferson counties wrote in his recent blog post. “Many factors affect corn growth and development, especially early in the growing season. A common question this time of year after corn is planted and some fields have emerged whiles other have not is “How many Growing Degree Days (GDD) does it take for my corn to emerge?” Since corn emergence is directly related to soil temperature (and of course soil moisture), the days to emergence vary especially when one compares early planting dates to later planting dates. The general assumption is 120 Growing Degree Days abbreviated GDD for corn to emerge under favorable conditions. However, we know that some planting practices and environmental conditions can decrease or increase the amount of GDD needed for corn to emerge. We use the GDD calculation for air temperature to estimate how long it will take corn to emerge even though soil temperature is the driving factor.
Growing Degree Days (GDD) or Growing Degree Units (GDU) calculation is determined from air temperature. The corn equation for GDD or GDU = (Daily Maximum Air Temperature + Daily Minimum Temperature)/2 – 50. When the maximum air temperature is greater than 86 degrees, we set the value at 86 in the equation, as the growth rate of corn does not increase much beyond 86. Likewise, when minimum air temperature is less than 50 degrees, we set the value equal to 50 in the equation. The sum of daily GDD or cumulative GDD for corn emergence is approximately 90 to 120 under favorable conditions. As a base line for GDD required for corn emergence, colleagues at the University of Wisconsin report that 125 GDD are required for emergence. Based on research in Iowa, corn typically required 90 to 120 GDD from planting to emergence. This range assumes adequate soil moisture and will vary with planting depth, tillage system, and residue cover.
Research shows some adjustments are needed to help fine tune expected emergence dates based on GDD determined from air temperature. Planting practices that change the amount of GDD for corn to emerge include planting date, depth, and residue cover (view full table of variables at https://cropwatch.unl.edu/growing-degree-units-and-corn-emergence). It takes about 10-25 more accumulated GDD for emergence with early planting dates. Planting deeper than 2 inches will increase the number of GDD to emergence by about 15. More than 75% residue cover increases the accumulated GDD needed for emergence, ranging from 30 to 60 GDD more. Additionally, the soil moisture, soil condition, and soil texture change the needed GDD for corn to emerge. Dry seedbed conditions will require more GDD. Crusted or cloddy soils can increase GDD by 30 more. Heavy textured soils require more GDD than do coarse textured soils. Corn genetics also can affect GDD needed for emergence. Therefore, the amount of accumulated GDD from planting to corn emergence can range easily range from 90 to 200 GDD.
In Nebraska, the U2U tool (https://hprcc.unl.edu/gdd.php) can be used to determine local accumulated GDD based on your planting date. For example, at the tri-county corner of Saline, Jefferson, and Gage counties from May 1 to May 13, we accumulated 114 GDD and the 30-year average is 139. In summary, remember that numerous factors drive corn emergence and assuming a standard 120 Growing Degree Days (GDD) for corn to emerge will not always hold true.”
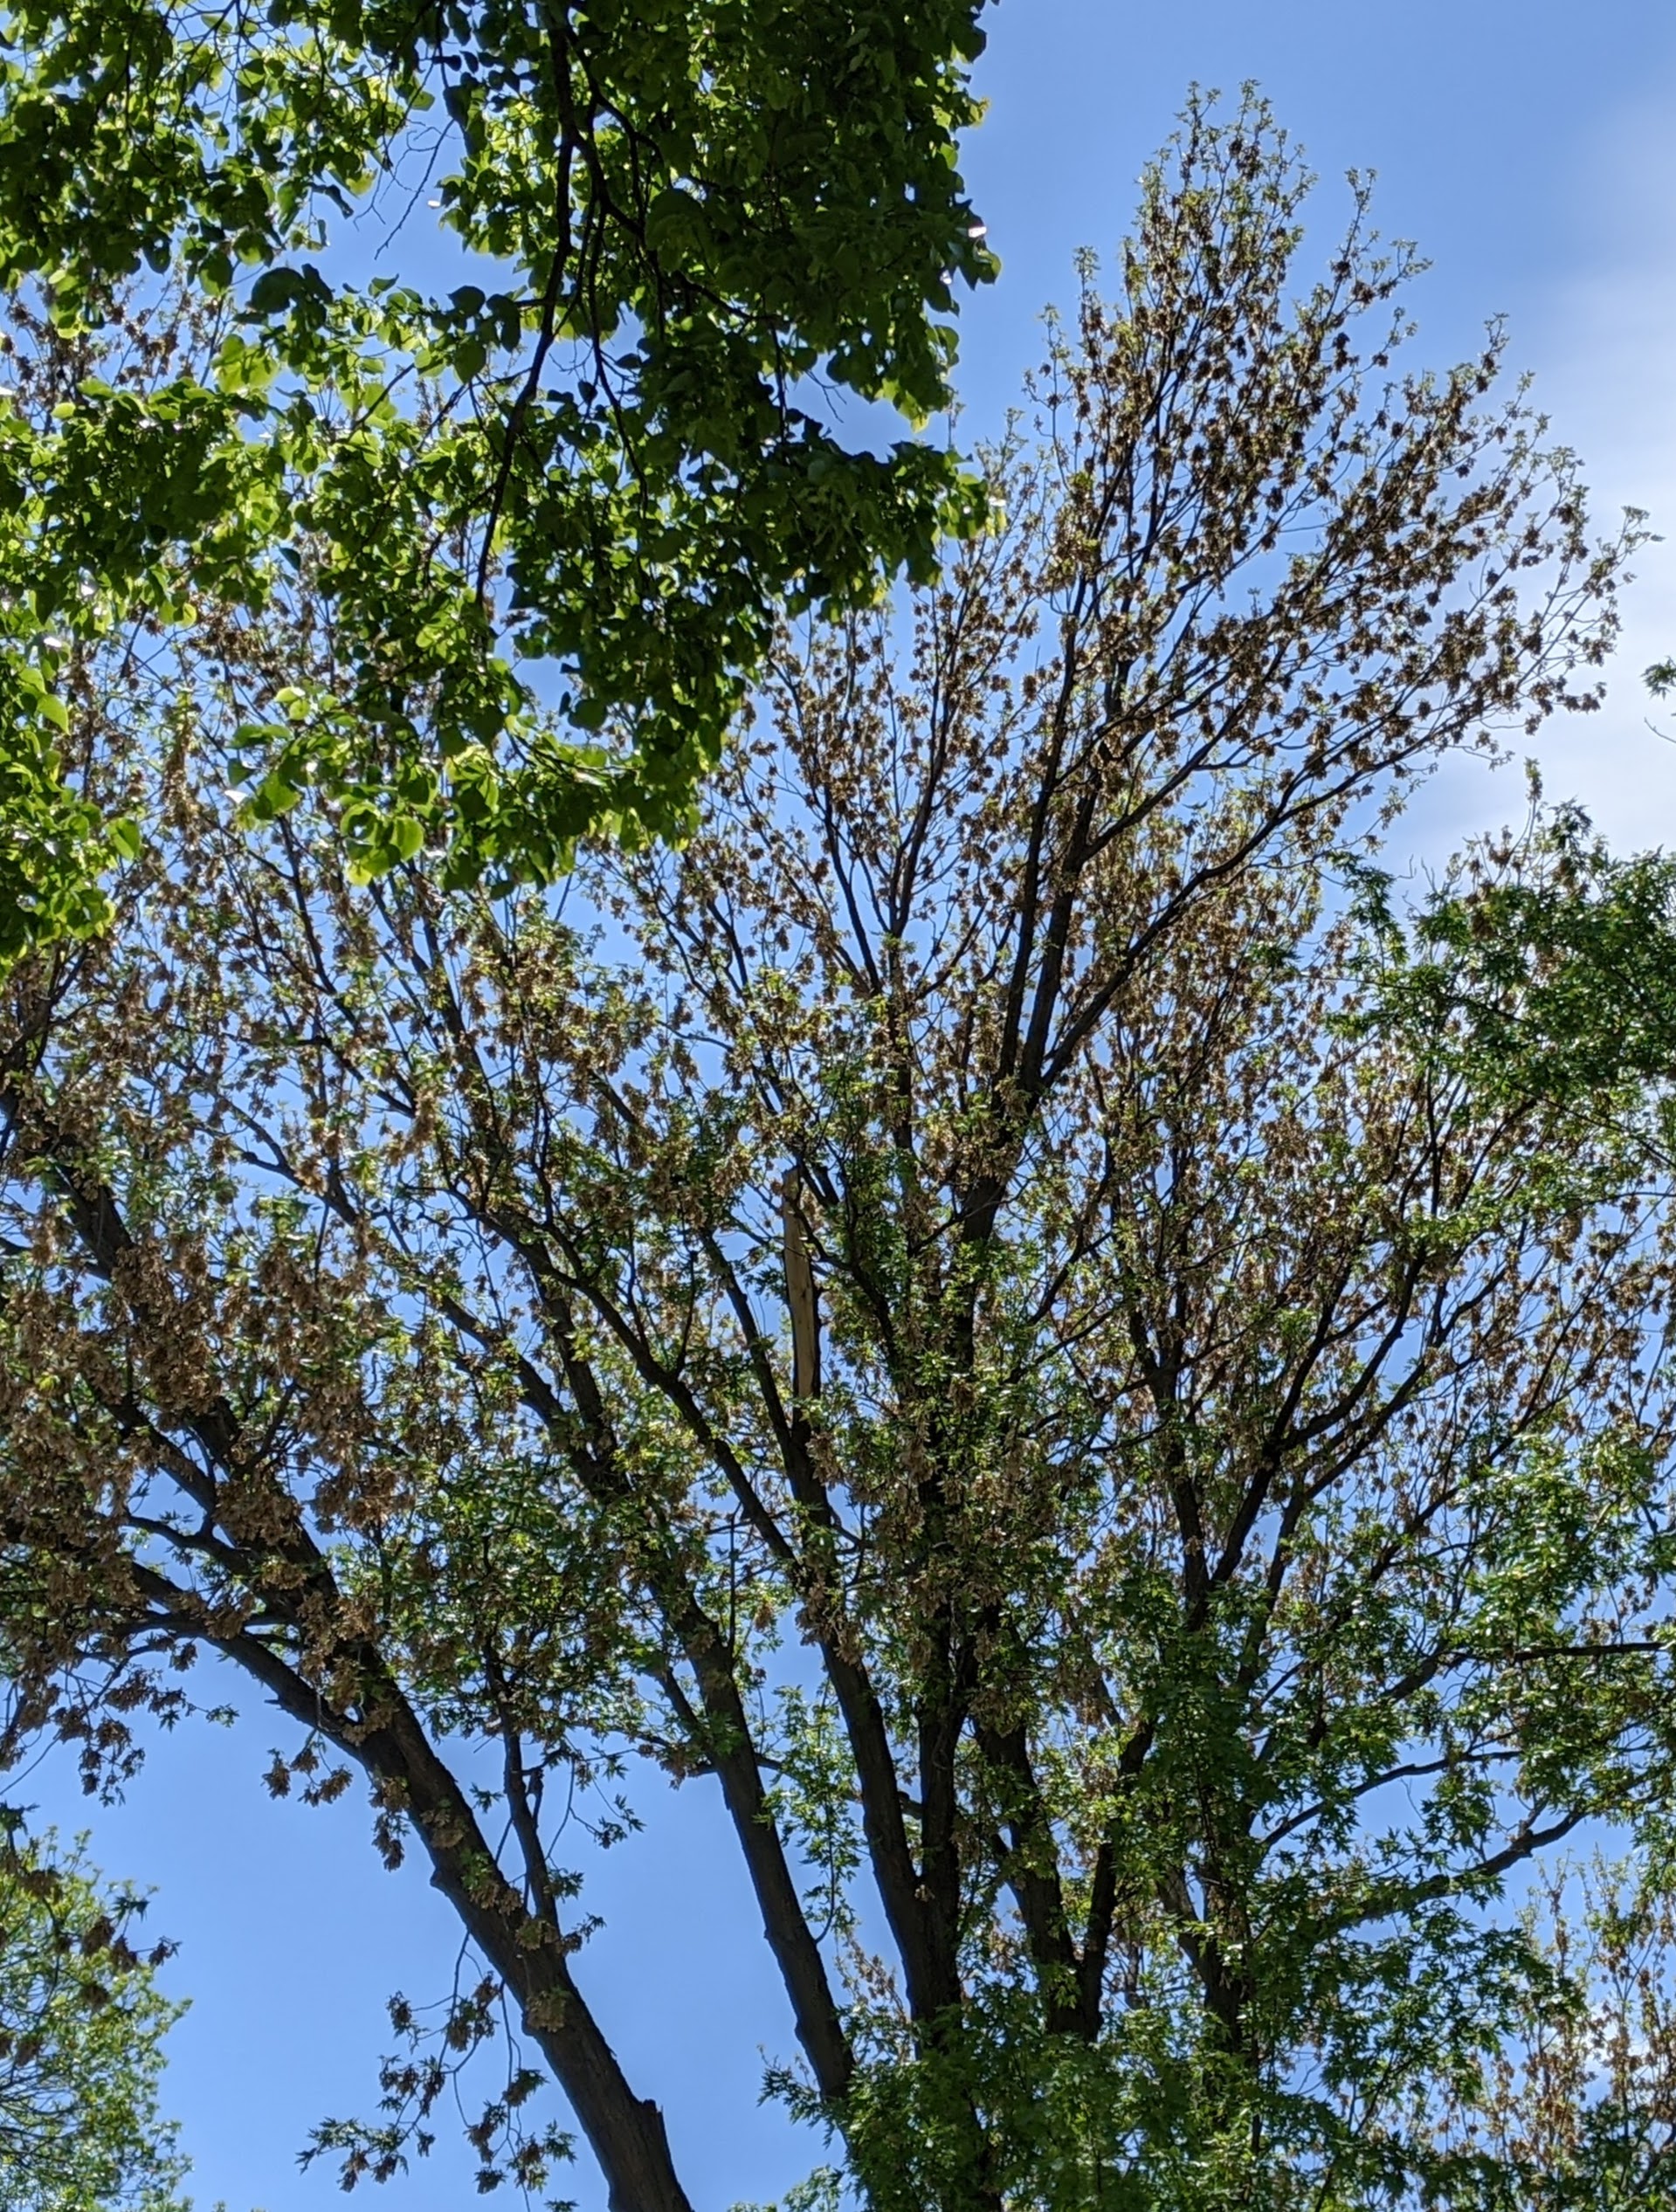
Tree seeds and leafing out: I’ve been watching silver/red maples and ash trees noticing that some, including one of mine, is very heavy in seed production like what we experienced in 2019. There’s also quite a range in oaks with some leafing out normally and others leafing out rather slowly. I think the seed production possibly is due to the warm March. Information from Ohio State shared that, “Every spring, maple trees produce small flowers that turn into seeds. Normally, a cold frost kills some blossoms, but this year the usual chill didn’t arrive at the right time. More blossoms than usual turned to seed.” Oaks leafing out at different rates could be due to the fact we’ve had a cool April/May and it’s also a survival mechanism to not all leaf out at once. We’ve also been experiencing some oak decline (which is also observed in August when leaves prematurely turn brown), and this can also result in slower leafing out. These are just some thoughts; I really don’t know the answers, just sharing that for those who are asking, I’m also observing this.
JenREES 5/9/21
Hopefully the rains were a blessing in helping the crops where crusting was a concern, adding moisture to the seedbed, and in activating herbicide. This article reaches people throughout the State, so with some experiencing frost potential as I write this, if rhubarb leaves are not damaged too much by frost and the stalks remain firm, it is still safe to eat. If the leaves are severely damaged or the stalks become soft or mushy, do not eat these stalks. Remove and discard them. New stalks can be harvested and eaten. Rhubarb often develops seedheads following cold temperatures, but this also does not affect eating quality of the stalks. Remove rhubarb seedheads and discard.
This week will share on the results we obtained from on-farm research studies where cover crops were interseeded into corn. In 2019, there were two locations in York and Seward counties (interseeded at V5-V6). In 2020, 6 of 11 locations were conducted via on-farm research in York, Seward, Clay, and Hamilton counties (interseeded at V4). Four of the six locations compared an interseeded cover crop to a check treatment of no cover crop. One location compared two corn populations (27,000 vs. 31,000 seeds/ac) to determine corn yield and cover crop biomass impacts. One location compared using only the middle drill unit to interseed the cover crop vs. using all three drill units between the rows to determine any differences in cover crop biomass.
2019 Results: In 2019, the cover crop at the Seward county location emerged and then died, we hypothesize, due to reactivation of Group 27 herbicide. Thus, no biomass samples were taken. At the York county location, cover crop biomass sampled prior to the first hard freeze ranged from 97-220 lbs/ac. It was good to see successful establishment at both locations and that cover crop growth occurred at one of them. In 2019, there were no yield differences between the corn in the check treatments (241 and 258 bu/ac) vs. cover crop interseeded treatments (241 (N mix), 243 (diversity mix), and 256 bu/ac) at the York and Seward locations respectively, which was also encouraging. Net return was less for the interseeded cover crop treatments vs. the check.
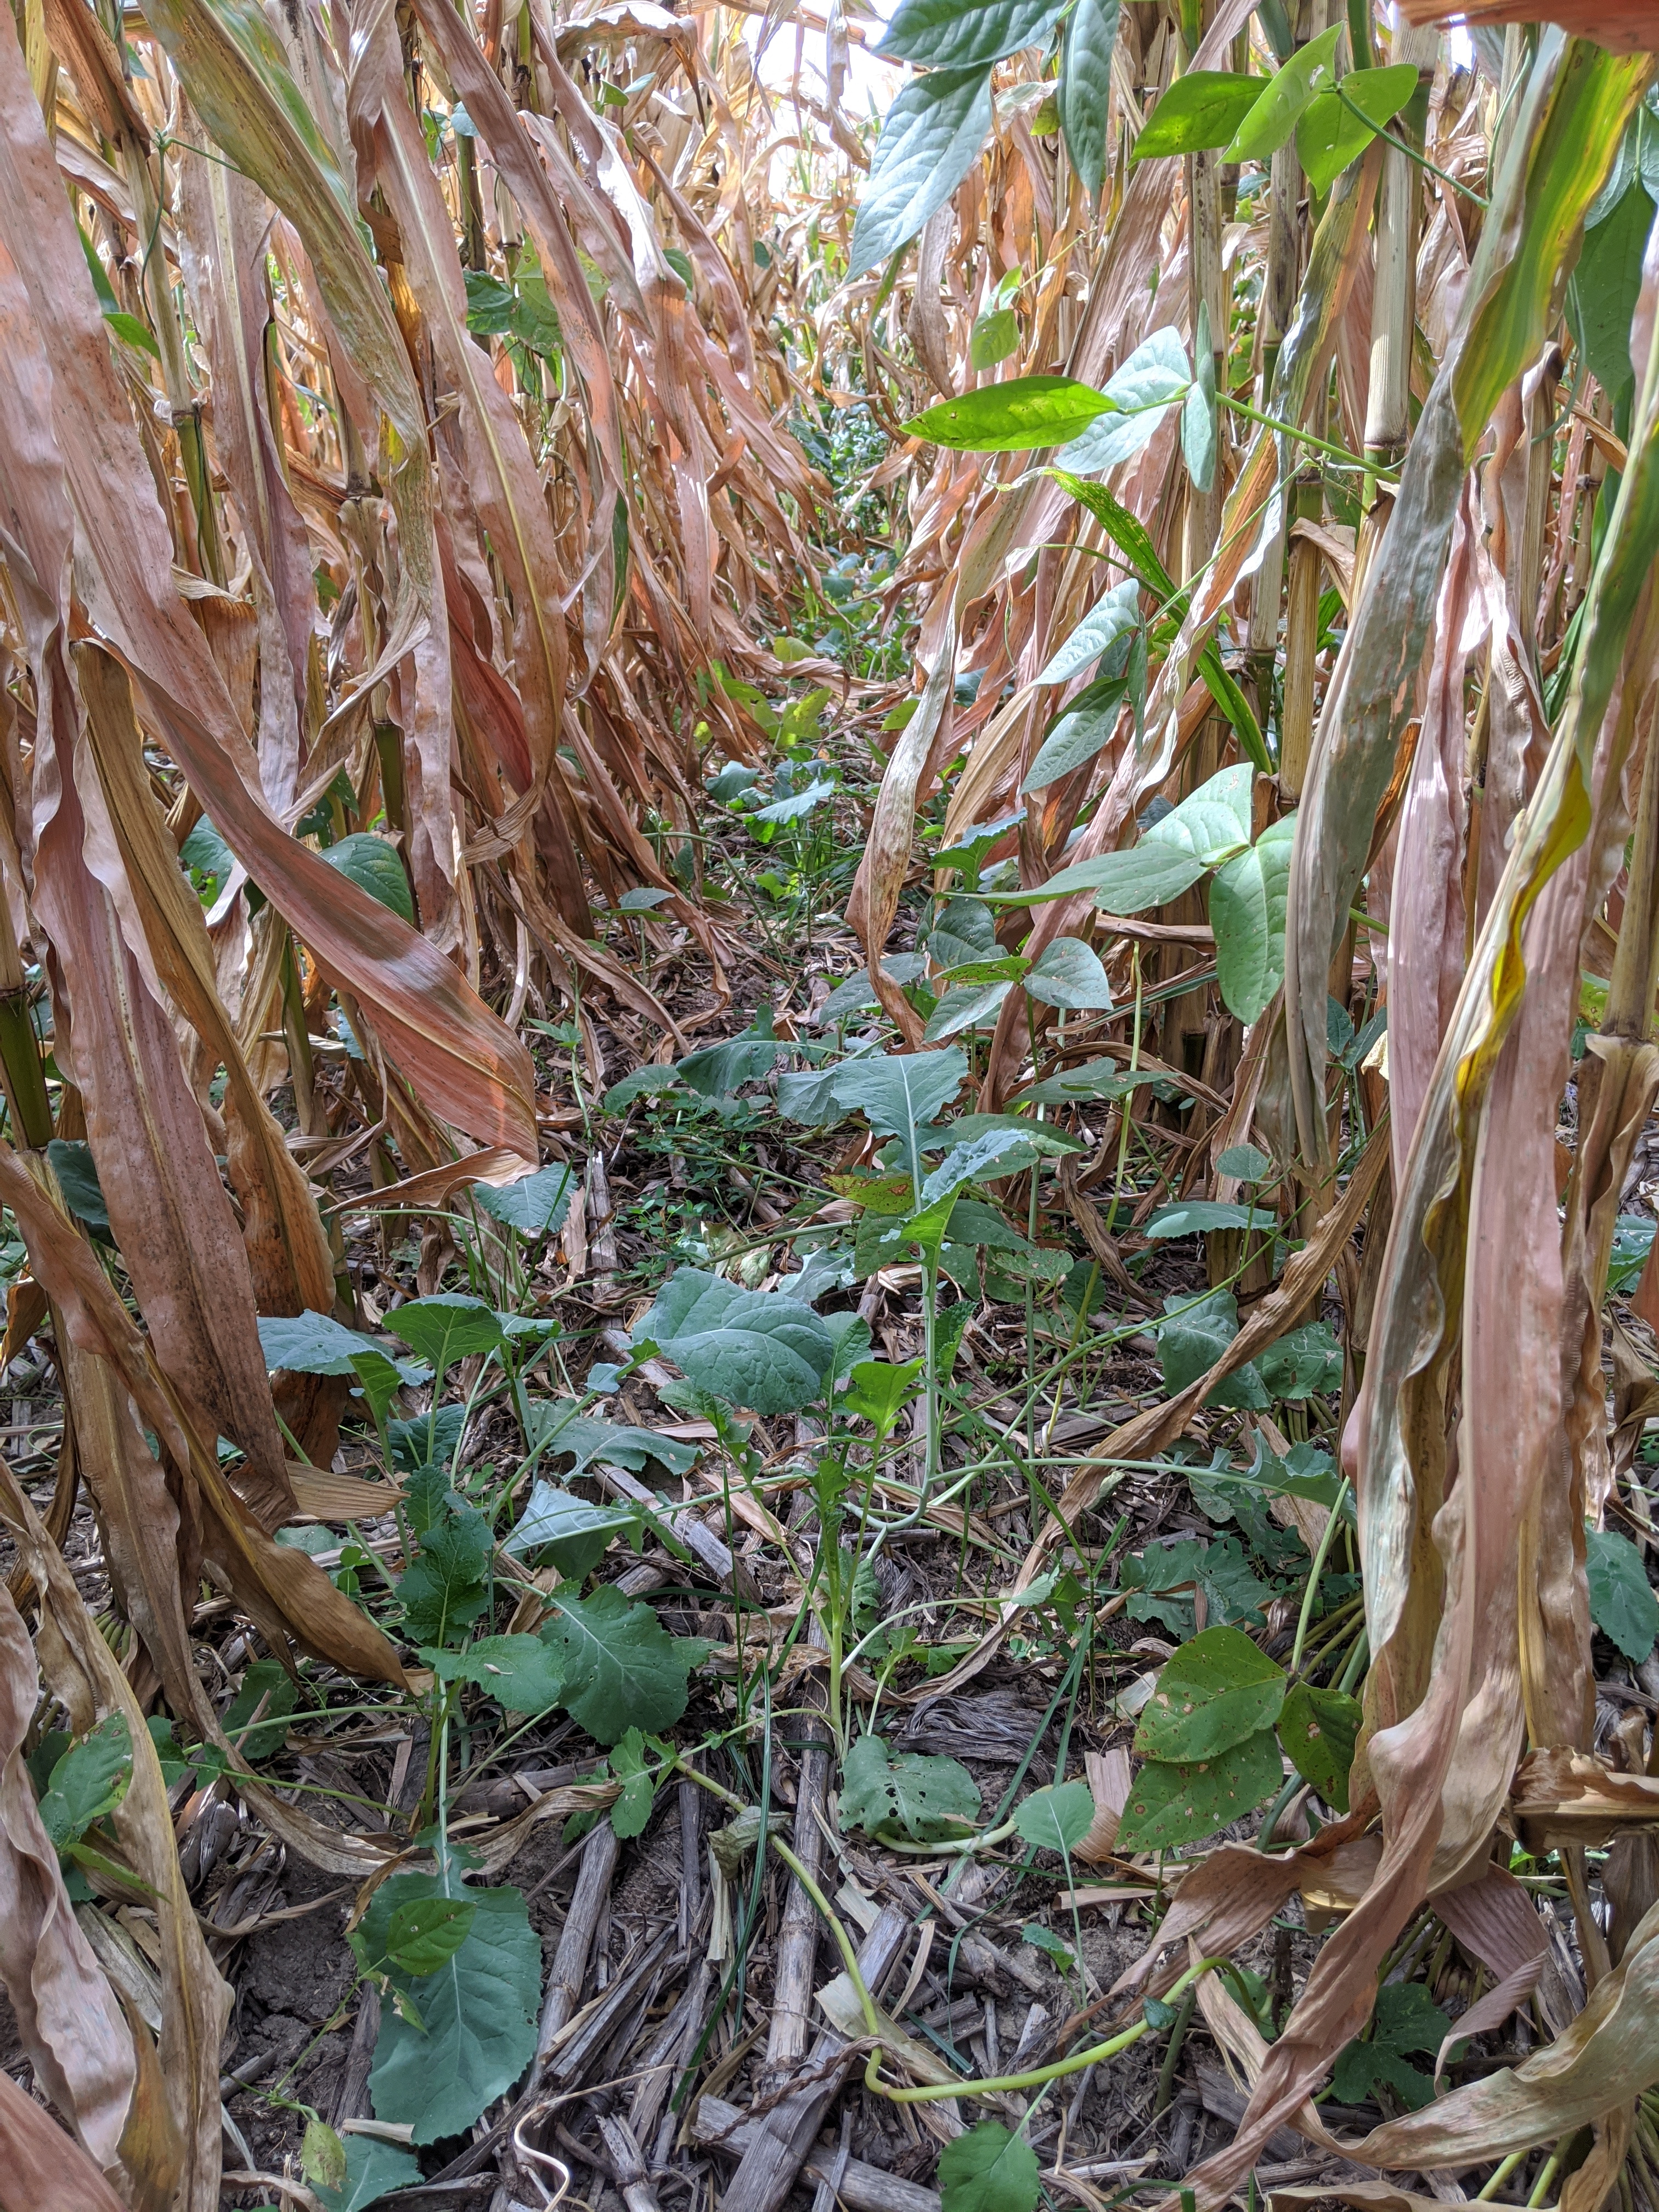
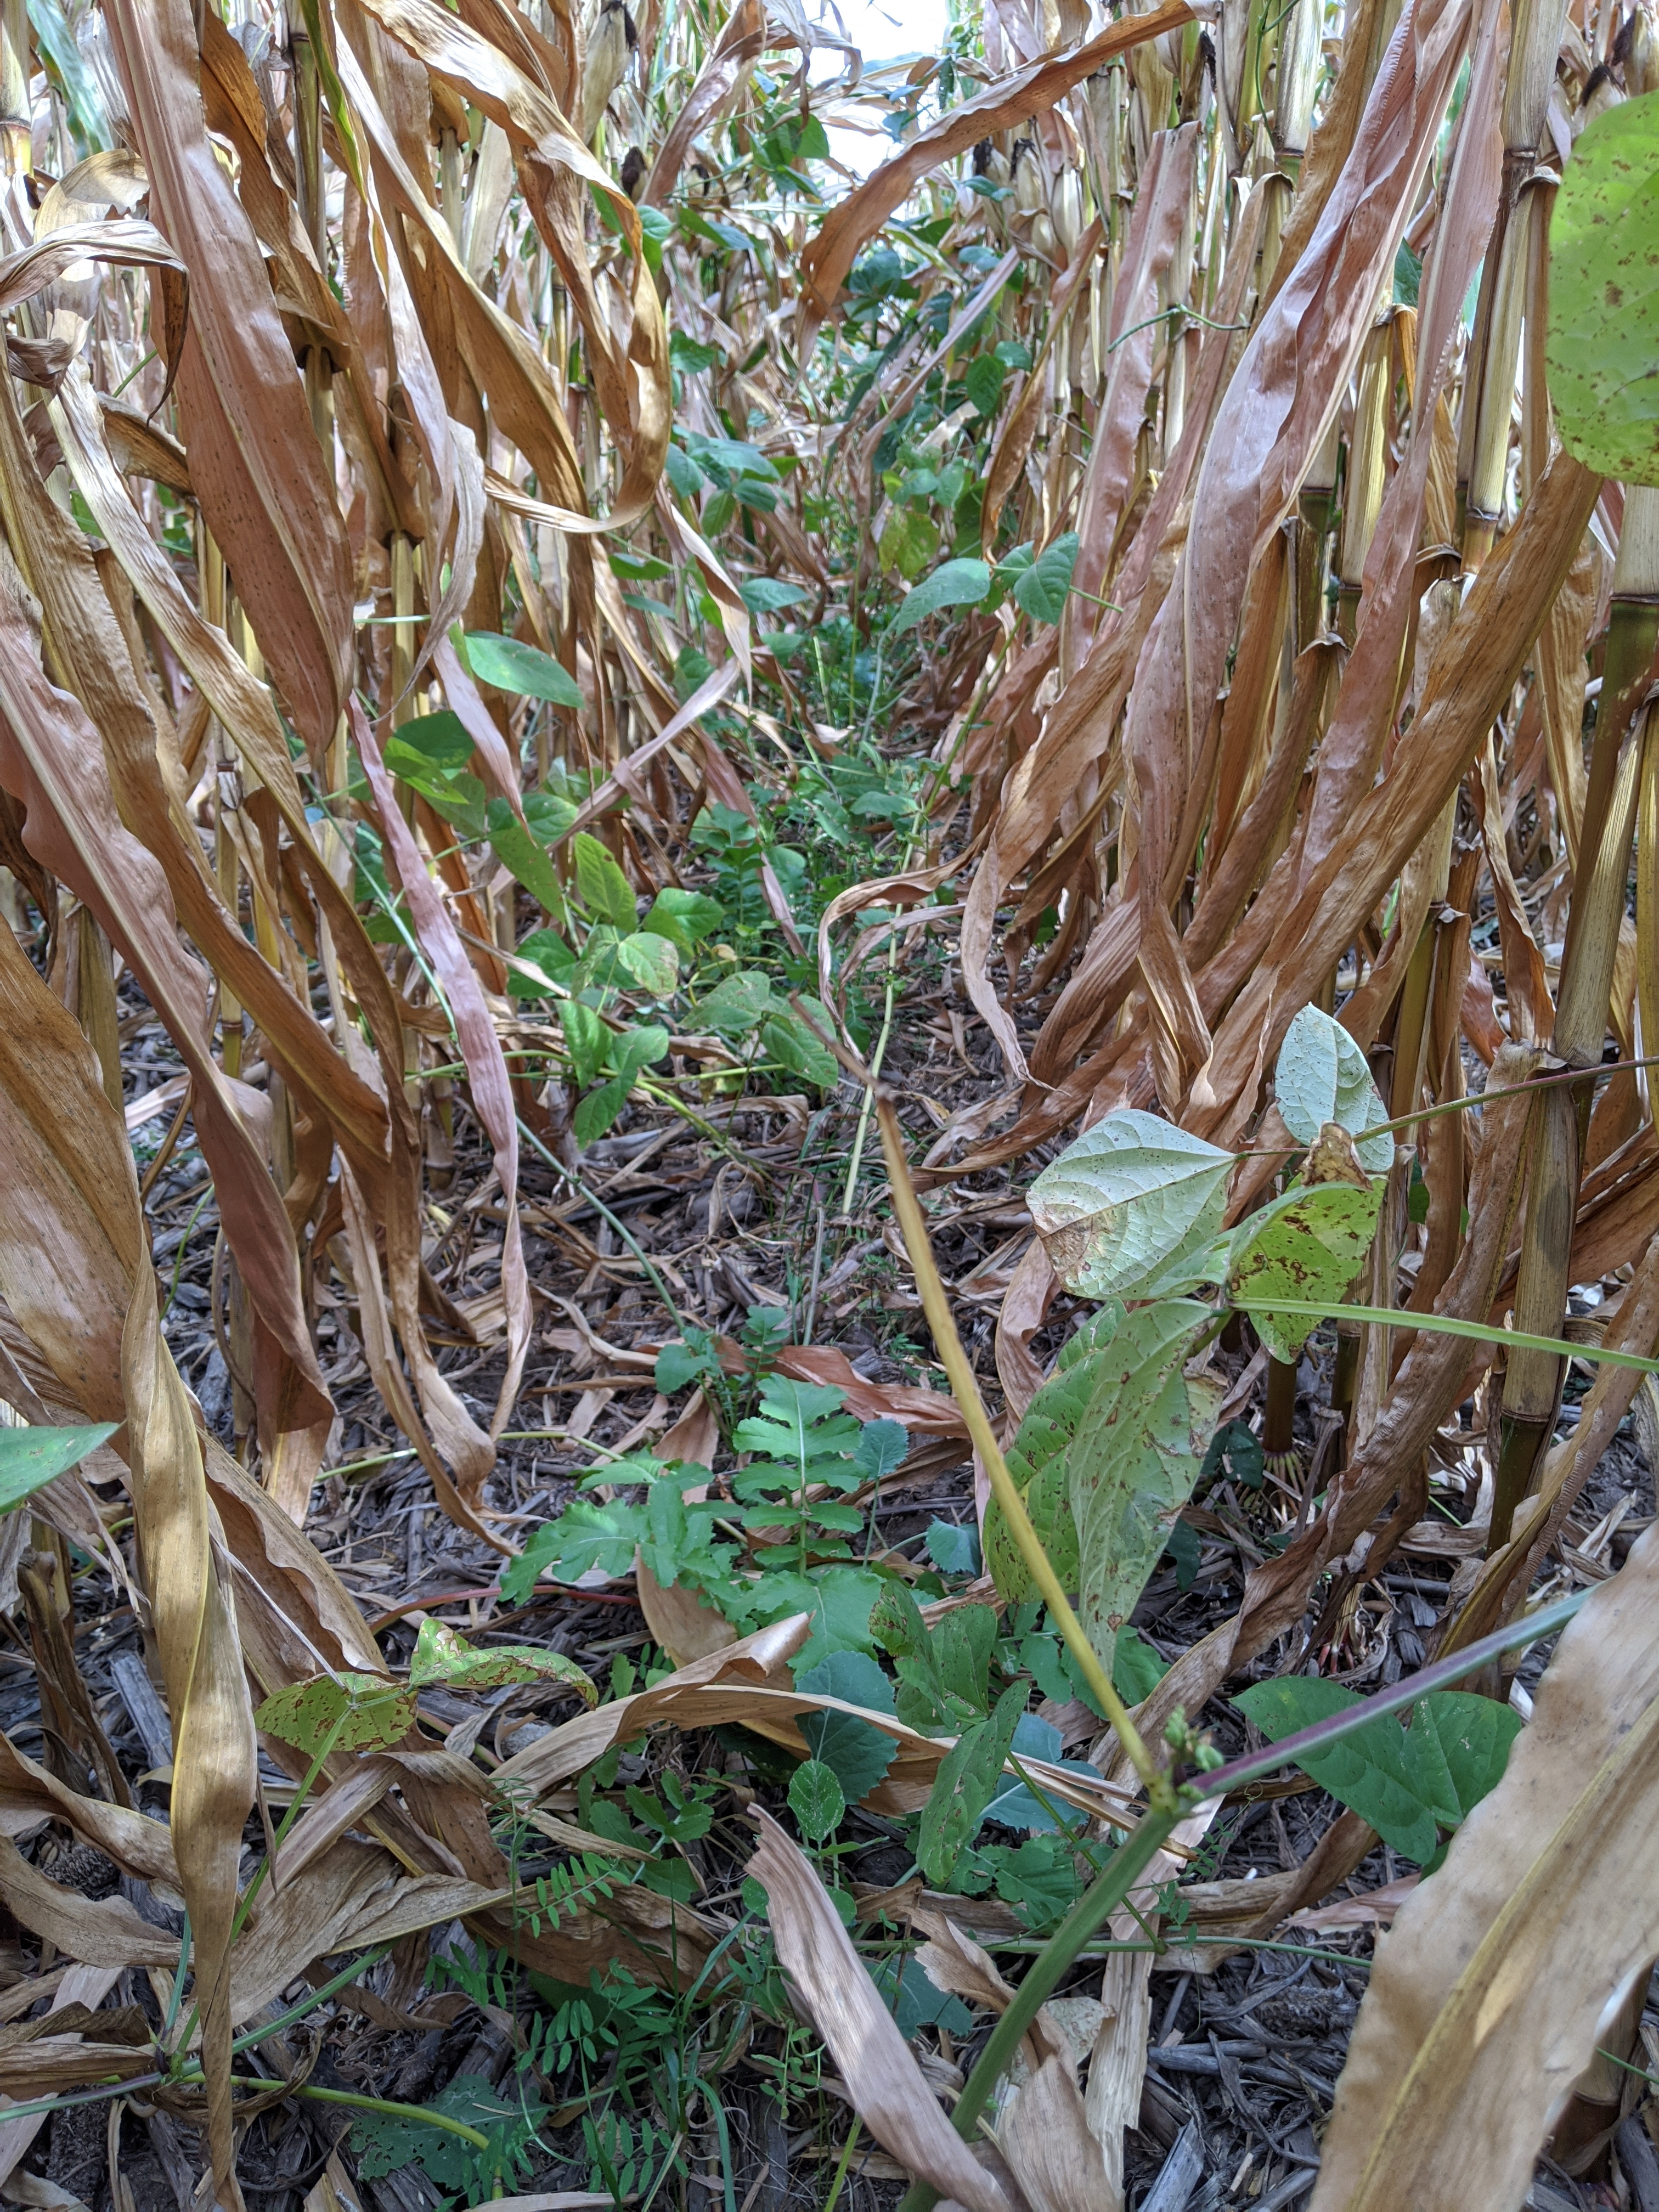
2020 Results: In 2020, cover crops emerged at all locations and grew throughout the season. Cover crop biomass varied by location with the most occurring in fields that were damaged by the July 9, 2020 windstorm (the location with the greatest biomass had 45% green snap). Thus, the open canopy resulted in greater weed and cover crop biomass. Biomass samples were collected in late September by taking three 30” X 30” or 36 X 36” squares for each treatment (dependent upon row spacing). The samples were sorted in the field into weeds, interseeded forbs/legumes, and interseeded grasses and placed in separate paper bags. Samples were weighed and dried. We wanted to compare any differences in weed biomass between the check and interseeded treatments, especially since no residual herbicides were used in 2020. There were no differences in weed biomass between the check and interseeded cover crop treatments. Total cover crop biomass accumulated varied by site and ranged from 277 lb/ac to 3818 lb/ac. It should be noted that the cover crops continued to grow after we sampled until the first hard freeze occurred. The cowpeas provided the greatest biomass and grew to the tops of the tassels. They also formed a ‘bridge’ between corn rows where the canopy broke open. Cowpeas, hairy vetch, sweetclover, and forage soybean were all fixing nitrogen during the 2020 growing season. The red clover and hairy vetch that survived the winter were fixing nitrogen in the spring of 2021.
The windstorm greatly impacted yields as well. Across all the sites, corn yield for the check averaged 214 bu/ac while corn yield for the interseeded treatment yielded 209 bu/ac. At four of the six sites, yield was significantly lower where the cover crop was interseeded. At the remaining two sites yield was not different between treatments. Net return for the corn where the cover crop was interseeded was less at five of the six locations. Net return includes the yield and price of the corn crop and cost of cover crop seed and application. Other than the York county location (two years), all the location data is based on one year of research. These studies will continue in the same fields and strips for at least three years, so it will be interesting to watch for any changes in soil biological and physical properties over time as well. Visually, in the field where the center drill unit vs. 3 was used, it appeared that the 1 drill unit had more biomass. Statistically, it ended up the same as the three drill units for total cover crop biomass. At the York location where cover crops were interseeded into two corn populations, there were no yield differences between the corn populations; however, both yielded less than the check treatment. A special thanks to all the growers working with us on these interseeding cover crop studies and to The Nature Conservancy, Upper Big Blue NRD, NRCS, and Kellogg’s for their partnership with Nebraska Extension on this effort. If you’d like more information, I’ve provided tables of data and links to videos we produced at my blog site jenreesources.com.
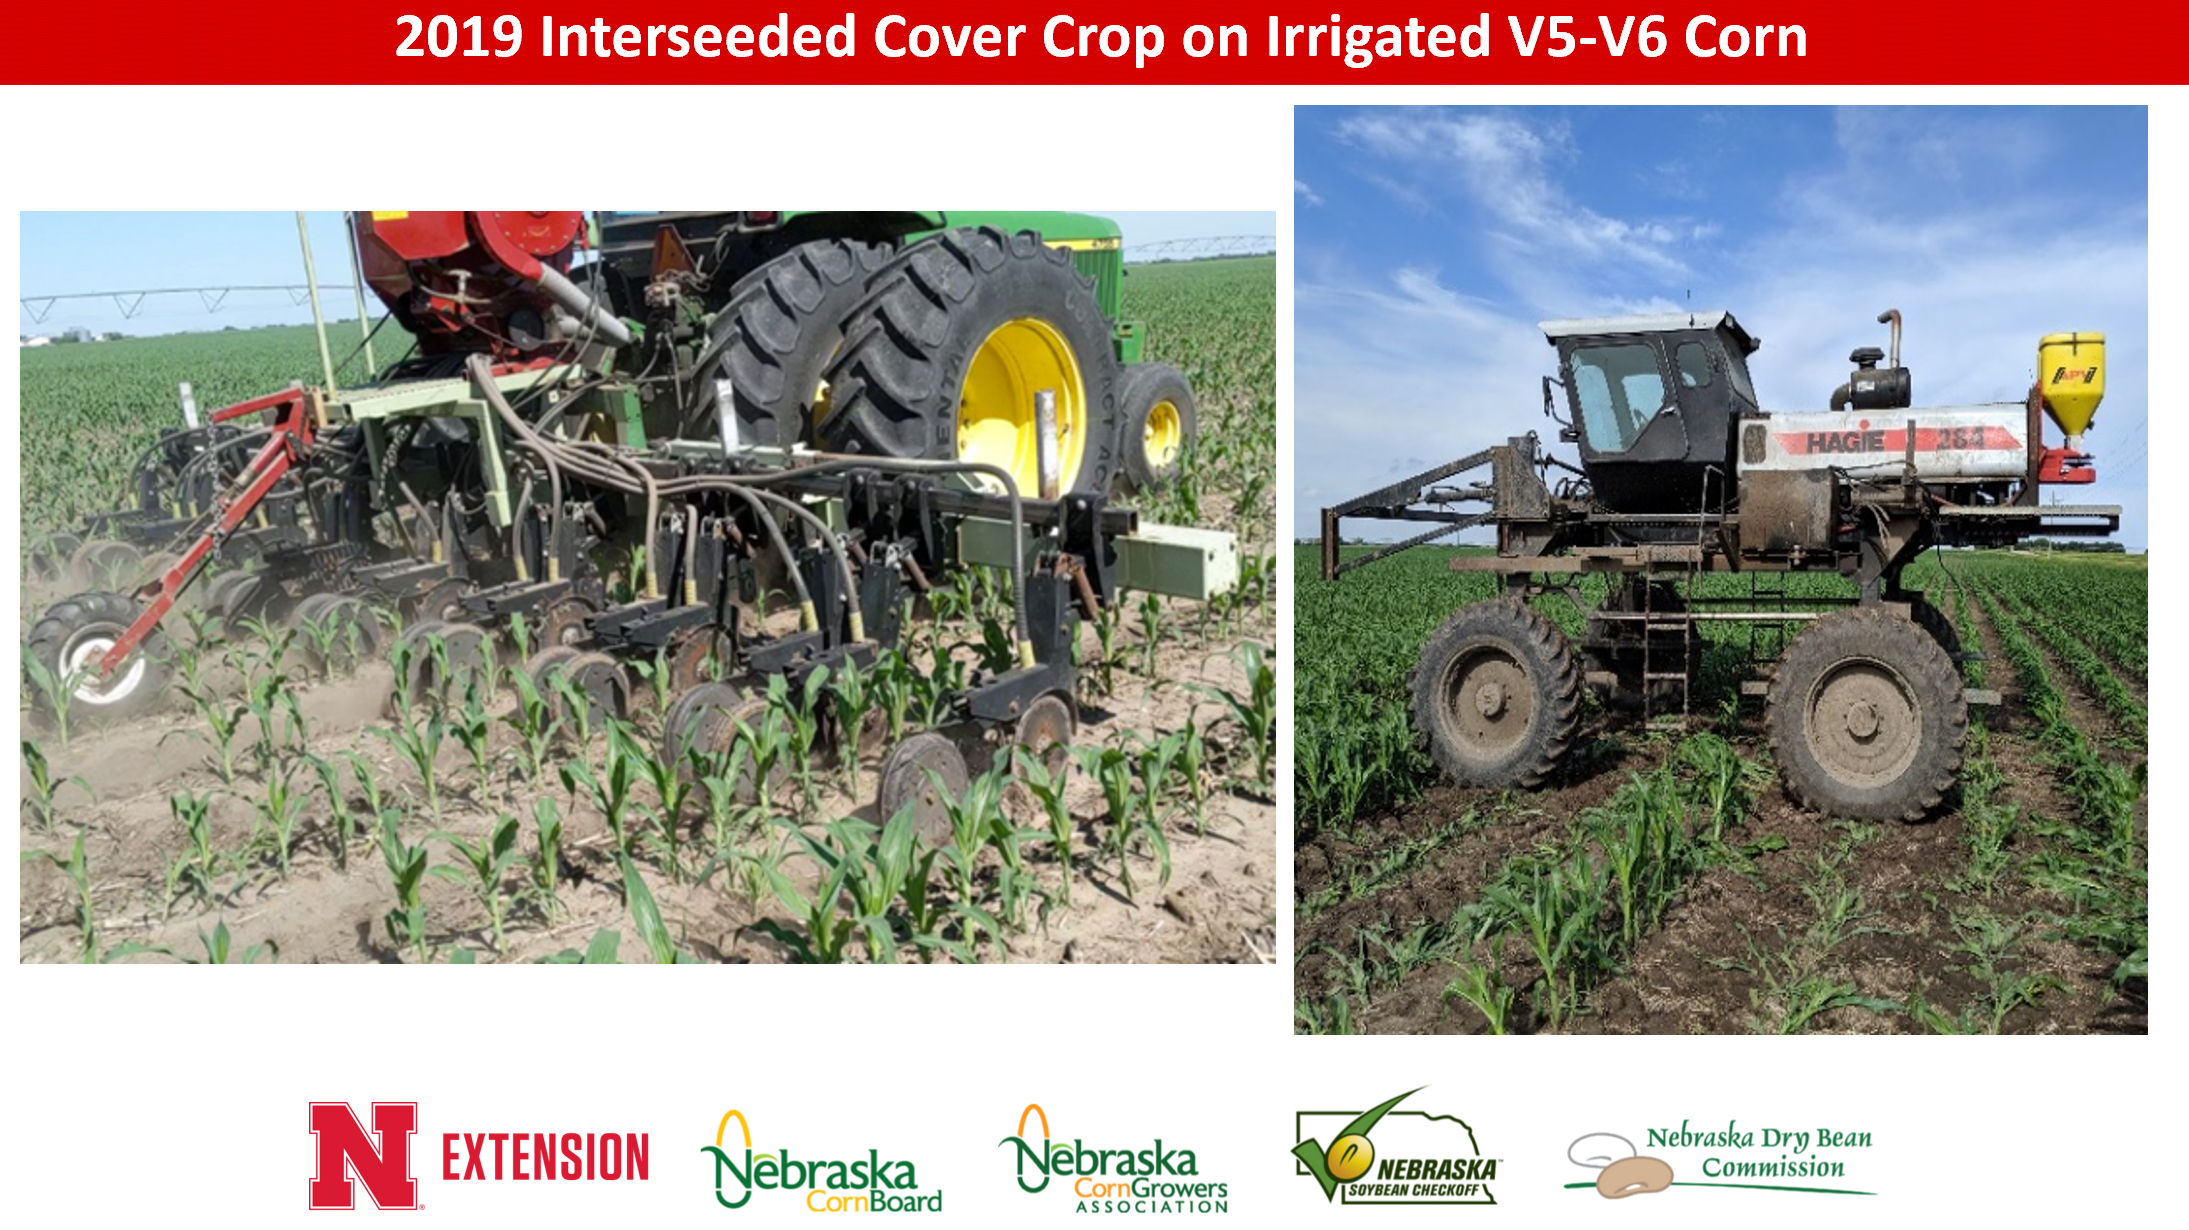
0.5 lb/ac chicory) interseeded at V5-V6 corn vs. check treatment.
Seward County (right), a Hagie was used to broadcast interseed 10 lb/ac red clover and 5 lb/ac buckwheat into V6 corn vs. check treatment.


* denotes statistically significant at 90% confidence level.

Cover crop biomass as a result of interseeding using three drill units (left) vs. only the center drill unit (middle). Close up of Penn State Interseeder drill units (right).
Nebraska On-Farm Research Virtual Field Day Interseeding Videos:
- Interseeding drills: https://cropwatch.unl.edu/interseeding-cover-crops-steve-melvin-june-12-2020
- Interseeding into Soybean: https://cropwatch.unl.edu/interseeding-cover-crops-soybeans-steve-melvin-june-10-2020
- Interseeding studies: https://youtu.be/gQKAGzkweG4
- Interseeding Mixes: https://youtu.be/b64PCMV1pwc
- Interseeding and Herbicide programs: https://youtu.be/5P8tE3oQ7hA

