Blog Archives
Southern Rust
Several of us had been watching the USDA IPM Pipe Map for weeks. It wasn’t showing southern rust moving and only Georgia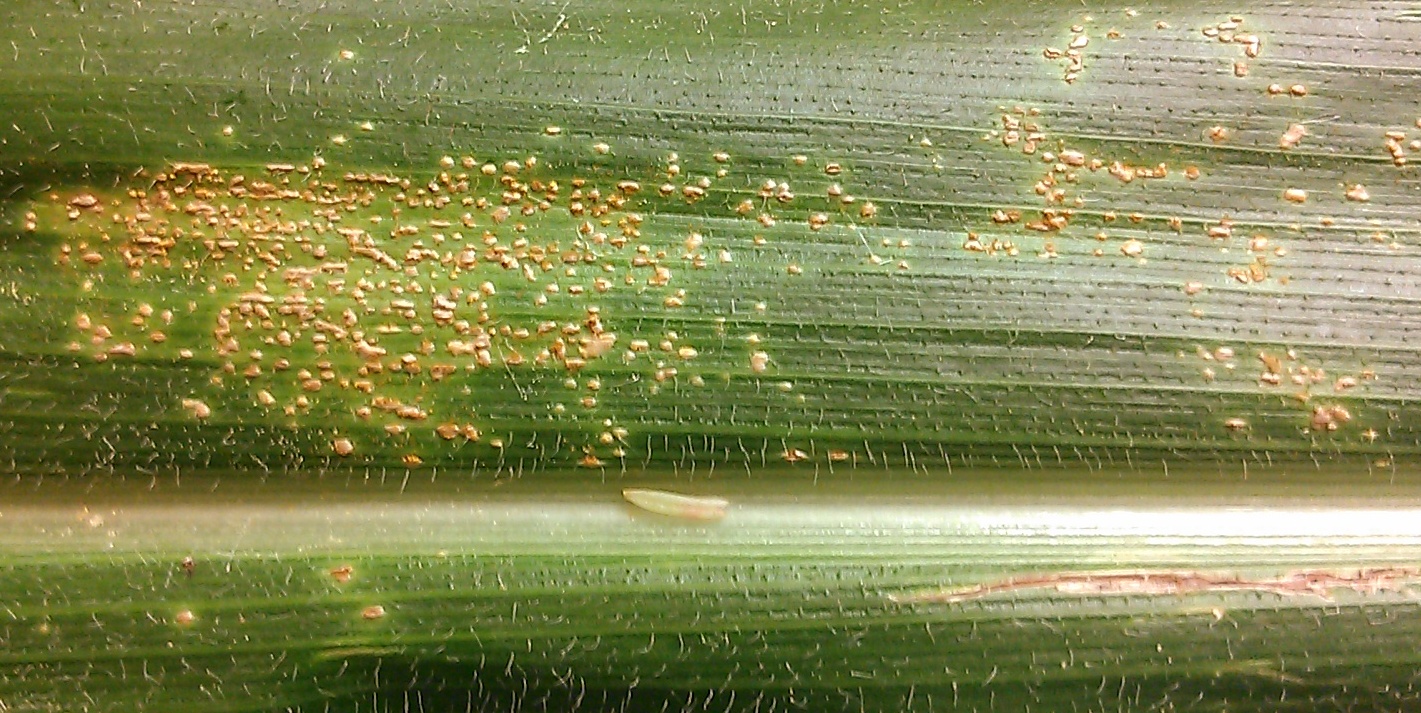 was really lit up. Yet, I had heard reports in Texas and Oklahoma at one point. Spots were evident on corn leaves when backlit-so they were bound to develop into something.
That something has showed itself to be southern rust last week as it was confirmed in 11 Nebraska Counties: Kearney, Adams, Clay, Nuckolls, Thayer, Fillmore, Gage, Platte, Polk, York, and Boone. I’d like to thank all the crop consultants and ag industry professionals for sharing information on what we all were seeing and for submitting samples. 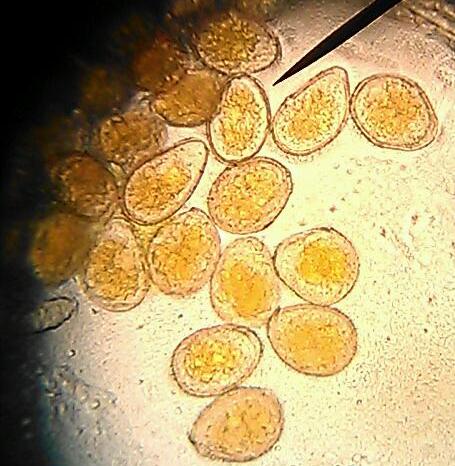
So the common question was, why didn’t the map show anything south of us? Federal funding was no longer available for this site and scouting efforts associated with it. Many Extension Plant Pathologists weren’t aware that the site was even still online and were sharing information via other means instead. The map for Nebraska will continue to be updated, but for surrounding states, it is advised to consult with your local Extension Plant Pathologist.
Differentiating Rusts:
When differentiating between southern rust vs. common rust, there are several criteria to consider and this NebGuide is a great resource. Typically common rust will have brick-red pustules randomly scattered on the upper and lower leaf surfaces that are larger in size.
For southern rust, we’re seeing very small, raised, tan-orange pustules on the upper leaf surface of leaves in localized areas on mid-upper leaves. These pustules are tightly clustered on the leaves.  However, color and size are relative as sometimes the two diseases can look alike.
Microscopic observation is the best way to differentiate the two diseases. Fungal spores from Puccinia sorghi causing common rust will be near perfect round circles whereas fungal spores from Puccinia polysora will be oblong in shape.
Disease Progression:
With the cooler weather last week, we were unsure how the disease would progress. Southern rust likes sustained temperatures in the 80’s-90’sF with humidity and leaf wetness. So we encourage scouting for it.
We saw how southern rust can be devastating to fields in the past regarding removing photosynthetic tissue leading to cannabalization of the stalk. In determining a fungicide application, consider  disease pressure in your field, stage of growth, pre-harvest intervals, and length of time for fungicide residual in addition to economics.
Look-A-likes:
Other plant samples brought in contained diseases such as physoderma brown spot (which isn’t a significant yield limiting disease of corn). Because the spores of this fungus move via water (it’s closely related to oomycetes), numerous lesions can appear on leaves in bands or areas where water collects. While the lesions may look like early southern rust, there will be no pustules present and often the purple colored lesions will also be observed in the midrib, leaf sheath, stalk, and outer husks.
- More information can be found in this article from UNL Extension’s CropWatch.
Goss’ Wilt in Corn
Goss’ wilt was found this week in corn damaged from Memorial Day storms in Clay County. I’ve also received pictures that appeared to be Goss’ from crop consultants in other areas of the State. Goss’ wilt lesions have a wavy edge, have a varnished look to them when wet, and have characteristic black “freckles” within and particularly along the lesion edges. We are seeing some plant death due to the systemic version of Goss’ wilt. This can be seen by taking a cross-section of the stem and looking for orange discoloration in the vascular bundles. Because this is a bacterial disease, fungicides are not effective in controlling Goss’ wilt. If you are interested in trying a product that is labeled for treating bacterial diseases in corn, we would recommend you test its effectiveness via on-farm research. Spraying in a paired comparison treatment design will give you a true answer if the product made a difference for you or not.
To do this simply: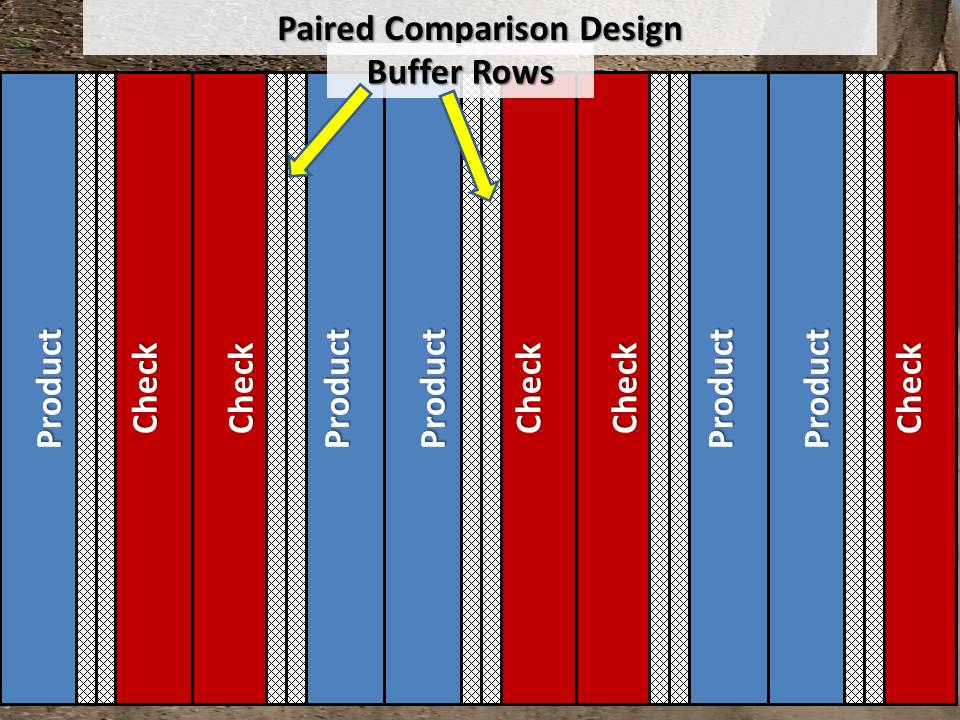
1-Spray a pass or round with the product (depending on sprayer size) to ensure you can harvest two passes from the center of the treated area.
2-Skip the same amount of distance as you previously sprayed.
Repeat steps 1-2 at least three more times
Mark a few plants in each plot and take photos throughout the growing season to determine if disease progresses or not. You may also wish to keep track of percent of plants affected in each untreated and treated area throughout the season, and check for percent stalk rot and harvest population in each area before harvest as well.
Make sure to harvest two passes from the center of each treated and untreated  area. Then compare the weights as shown in the harvest figure. Please let Jenny Rees jrees2@unl.edu (402) 762-3644 know if you decide to conduct this study and if you have any questions!
More information:
Goss’s Wilt from UNL
Sample Submission to UNL Plant and Pest Diagnostic Clinic
Nebraska On-Farm Research Network
Crop Update 6-20-13
The sun has been welcomed and crops are rapidly growing in South Central Nebraska! Corn right now is between V6-V8 (6-8 leaf) for the most part. Quite a few farmers were side-dressing and  hilling corn the past two weeks. It never fails that corn looks a little stressed after this as moisture is released from the soil and roots aren’t quite down to deeper moisture.
Installing watermark sensors for irrigation scheduling, we’re finding good moisture to 3 feet in all fields in the area. The driest fields are those which were converted from pasture last year and we want to be watching the third foot especially in those fields. Pivots are running in some fields because corn looks stressed, but there’s plenty of moisture in the soil based on the watermark sensor readings I’m receiving for the entire area. So we would recommend to allow your crops to continue to root down to uptake deeper moisture and nitrogen.
The last few weeks we observed many patterns from fertilizer applications in fields but as corn and root systems are developing, they are growing out of it. We’ve also observed some rapid growth syndrome in plants. This can result from the quick transition we had from cooler temperatures to warmer temperatures, which leads to rapid leaf growth faster than they can emerge from the whorl. Plants may have some twisted whorls and/or lighter discoloration of these leaves, but they will green up upon unfurling and receiving sunlight. This shouldn’t affect yield.
Damping off has been a problem in areas where we had water ponded or saturated conditions for periods of time. We’ve also observed some uneven emergence in various fields from potentially a combination of factors including some cold shock to germinating seedlings.
We began applying sugar to our on-farm research sugar vs. check studies in corn. We will continue to monitor disease and insect pressure in these plots and determine percent stalk rot and yield at the end of the season.
Leaf and stripe rust can be observed in wheat fields in the area and wheat is beginning to turn. We had some problems with wheat streak mosaic virus in the area again affecting producers’ neighboring fields when volunteer wheat wasn’t killed last fall. Alfalfa is beginning to regrow after first cutting and we’re encouraging producers to look for alfalfa weevils. All our crops could really use a nice slow rain right now!
Weed Science Field Day
Hope to see you at this weed science field day at UNL’s South Central Ag Lab near Clay Center on July 2nd! No charge. Please RSVP to (402) 762-4403. More information at: http://scal.unl.edu.

Wheat Scab Potential Risk
With the recent rains in Nebraska, the potential for wheat scab has increased. This video shares more information including a fungicide table of products to consider with product efficacy ratings for scab. For more information, please check out http://cropwatch.unl.edu. Thanks to Rachel Stevens, UNL Extension Intern, for producing this video!
Storm Damage to Crops
Memorial Day storms hit us again this year, this time with the EF2 tornado in Edgar. I checked NE Rain, and for the month, Clay County  received between 5.9-9.7″ of rain with nearly 3/4 of that coming in the last 6 days !
Even with the saturated soils and localized flooding, there is still potential for drought. It was this way last year at the end of May before the rains shut off in early June.
I’ve received questions regarding potential storm damage to crops. Normally I’ve found that waiting a week helps with determining regrowth and decisions. Overall, we’re fortunate that crops were so small. Much of the corn was V1-V3 and the soybeans were anywhere from not planted to cotyledon stage. The majority of damage occurred where emerged plants were silted over with soil and/or residue, standing in water for periods of time, of left with stems due to high wind and/or hail.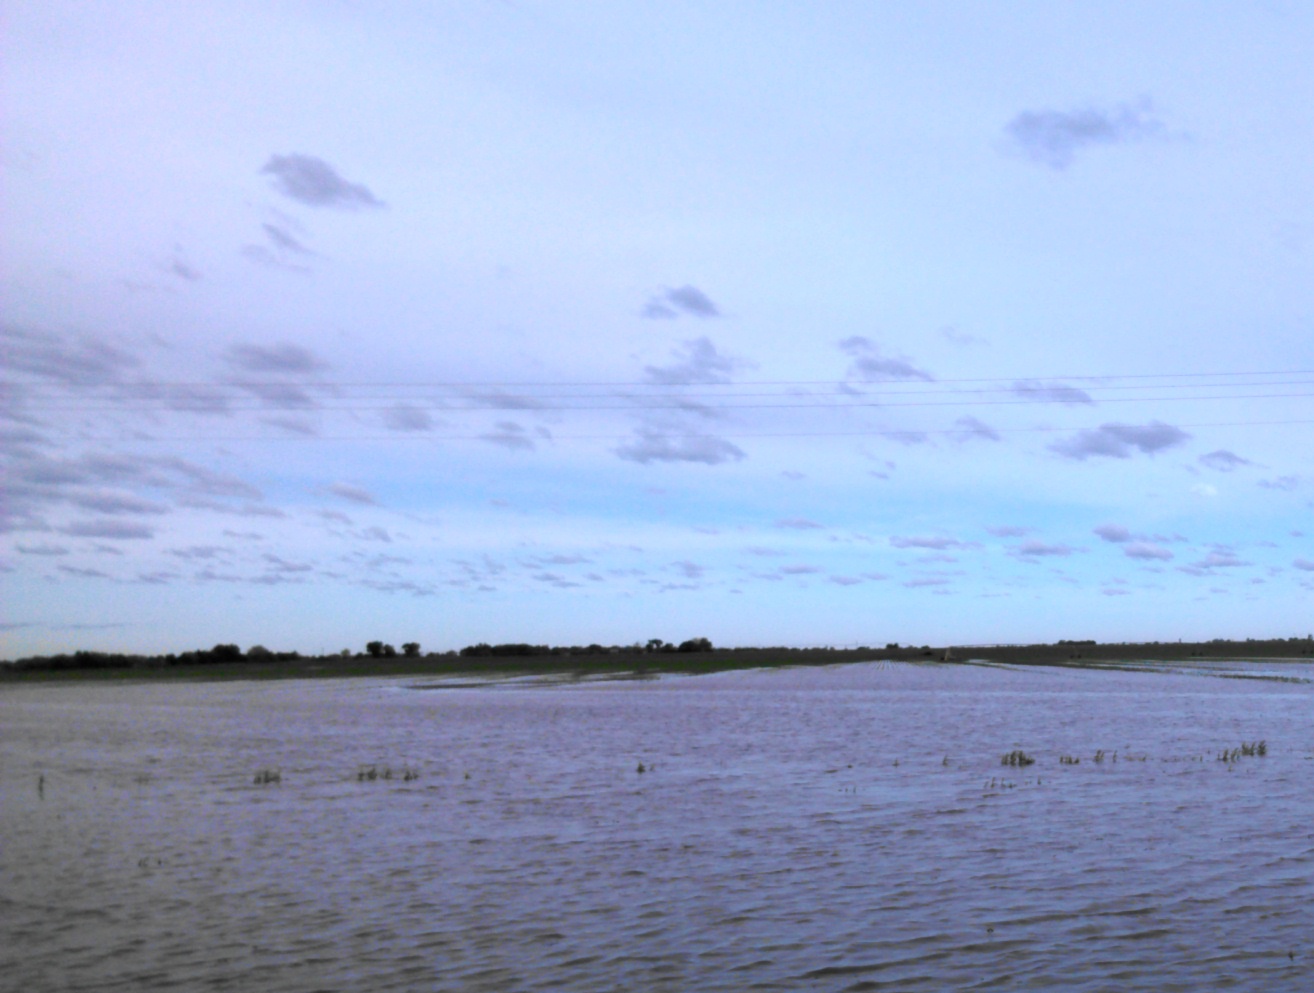
Corn Decisions
According to Purdue University Agronomist, Bob Nielsen, it takes around 48 hours for oxygen to be completely depleted from saturated soils. Plants that are emerged above the water have a better chance of survival than those below it; however, it’s hard to tell exactly how long plants can survive in those conditions. We also have several areas where plants were standing in water for a few days, the water receded, and now they’re standing in water again. Only time will tell how those plants will fare.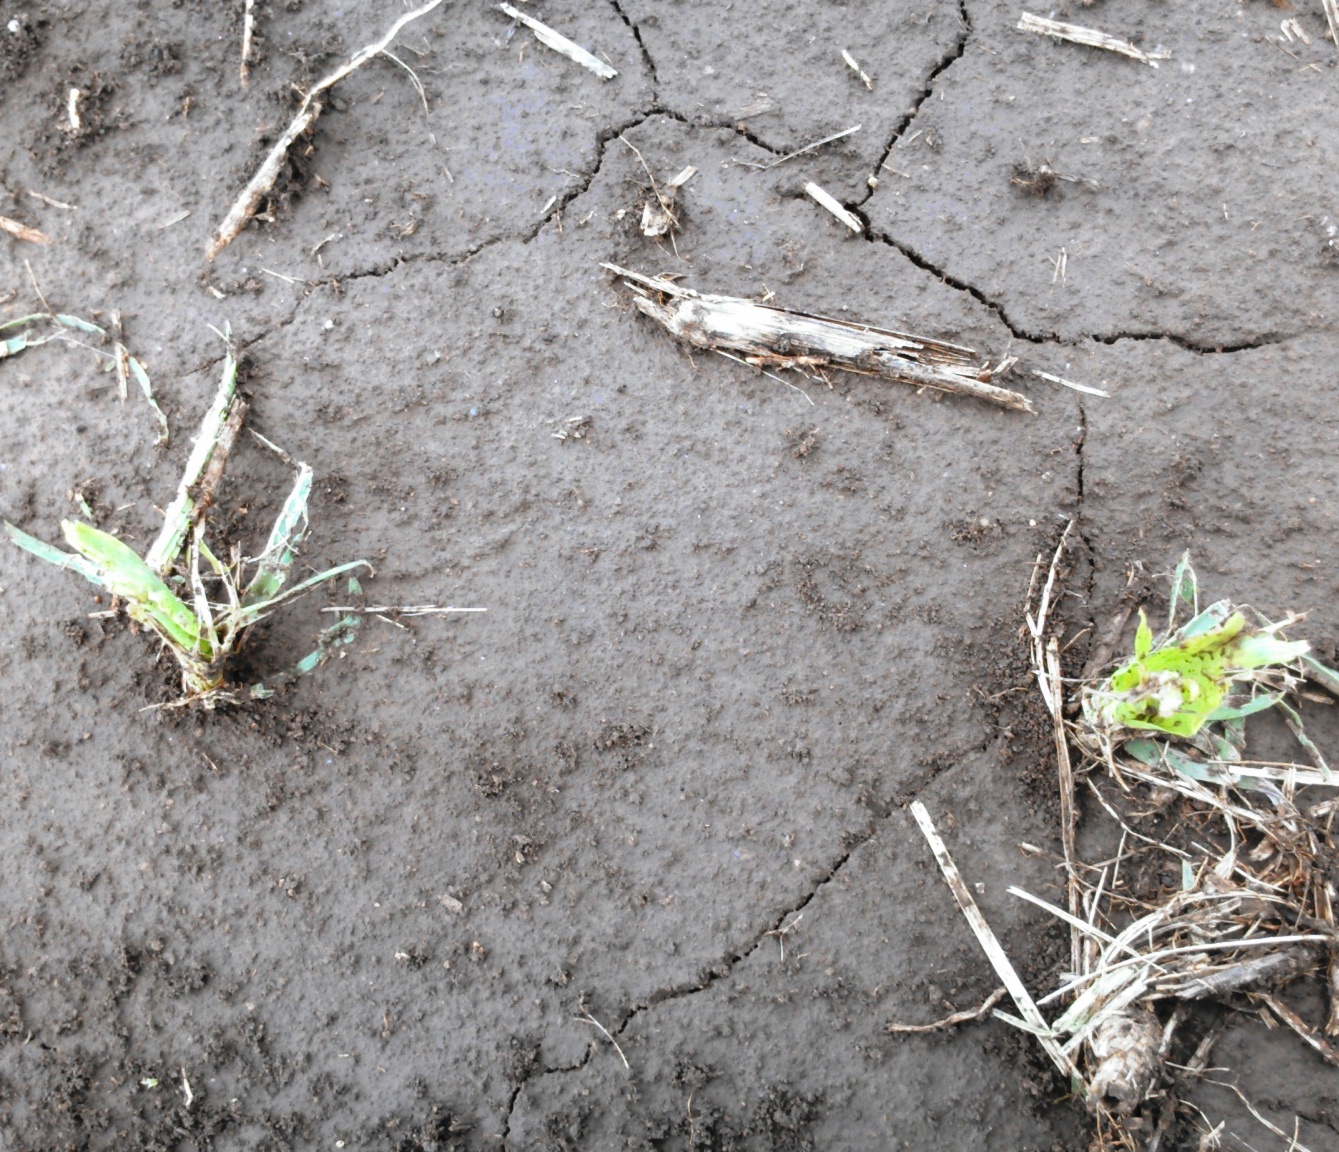
Because the growing point of affected corn plants is below ground, in many situations, plants should recover if the growing point remained healthy. Hopefully only small areas will need to be replanted. For crop insurance decisions and options, please check out the following CropWatch article.
Soybean Decisions
Some emerged soybeans that were at cotyledon stage have been reduced to stems leaving gaps between healthy plants. Soybean plants can compensate for reduced populations; however length of gaps and final stands do need to be assessed for replant decisions. UNL on-farm research has shown less than 1.4-2.0 bu/ac yield difference between planting 90,000 and 180,000 seeds/acre. (See report.) In our research, 90% of the planted stand was achieved at both seeding rates in irrigated 30-inch rows in no-till and ridge-till fields.
Consider what was found in 2006 in one dryland field in Nuckolls County where seeding rates of 100,000, 130,000, and 160,000 seeds/acre were planted. This  field was at the cotyledon stage when it was hailed. Some plant stands dropped to 67,000 plants/ac. Yield was 4 bu/ac less than in the 160,000 seed/acre planting that had a final stand of nearly 98,000 plants/ac. The average yield in the field was 40 bu/ac. While this is only one field and one year of research, it is an example of how soybean plants can compensate for reduced populations by branching and how August rains in dryland can still allow reasonable yields to be produced. Based on our on-farm research, leaving dryland stands of at least 65,000 plants/acre and irrigated stands of 90,000 plants/acre is likely a better choice than replanting, in the event that the gaps between plants are not large and are fairly even.
Many of the soybeans worst affected were reduced to stems. Last year we watched as soybeans continued to develop plumules after the hail events and soil crusting in our area. The plumule, which is the seedling stem tip and its undeveloped leaves above the cotyledonary node, may remain, but without the cotyledons to serve as a carbon and nitrogen source, development of new seedlings with small leaflets will be slow. These plants may not become competitive with surrounding plants in terms of pod and seed production. Therefore, when counting seedlings to determine plant stand, count only the seedlings that have at least one cotyledon. You can count seedlings missing cotyledons if they have large unifoliolate leaves that will soon unroll as in this picture.

In summary,
we will monitor damage early next week to help with replant decisions. Overall, I feel we are fortunate that the crops were so small and crop damage does not appear to be severe other than all the pivots that need to be replaced. We will also need to watch for potential disease damage in weakened plants. For crop insurance decisions and options, please check out the following CropWatch article.
Preparing Irrigation Scheduling Equipment
It’s wonderful receiving the rain we did, seeing how quickly planting progress came along, and how quickly corn is popping out of the 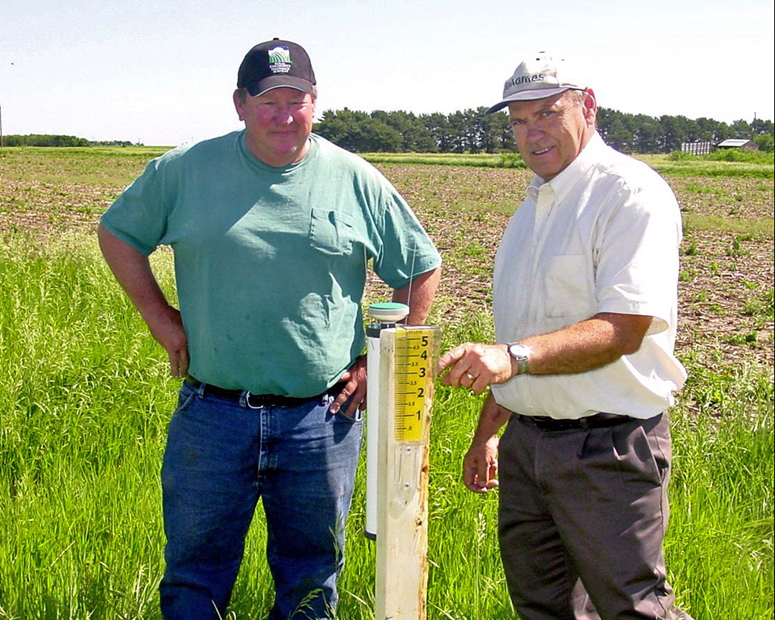 ground! Being mid-May, it’s time to get our Evapotranspiration (ET) gages out. A reminder to only use distilled water in the gages, make sure to fill up the ceramic top portion of the gage before inserting the stopper, and gently dust off the ceramic top and replace the white membrane and green canvas cover. We recommend replacing those membranes and covers each year so if you need a new one, please let the Natural Resources Districts (NRDs) or me know and we’ll get you a new one! For those of you recording ET information online, please be sure to do so consistently each week to help your neighbors and crop consultants.
Early after crop emergence is the best time to install watermark sensors. For those of you with watermark sensors, read them to ensure they read 199 kpa (dry). Then “prime” them first by soaking them for 24 hours in water to ensure all the air bubbles have been released. The sensors should have a reading of 10 kpa or below to be considered good. If they read higher than that, either continue soaking them another 24 hours and read them again, or plan that they no longer are reading correctly and replace them with others from the NRDs. Remember after soaking sensors that water moves up into the PVC pipe via capillary action, so be sure to dump the water out of the pipe  as well.
When installing the sensors, be sure to install them wet, drain excess water, and look for areas that are not compacted, avoid tractor wheel tracks, and look for even spacing of plants. Carefully install without breaking off any plants (thus easier when plants are small!). It’s also important not to install sensors into extremely wet fields. What we have found is that a thin soil layer can cover the sensor when pushing it into the soil of very wet fields. When that soil layer dries, it can provide a reading of 199 saying the sensor is dry when it truly isn’t. If this happens to you, simply remove the sensor, rewet for one minute and re-install. It should be acclimated to field conditions within 48 hours. If you have any questions regarding the installation process, please let the NRDs or your local Extension Educator know. You can also view videos of the installation process and receive additional information to answer your questions.
Understanding Research Statistics
Dr. Charlie Wortmann, UNL Extension Soil Fertility Specialist, explains the power of statistics for understanding yield and other differences and non-differences for on-farm research.
Sugar Applications to Crops
For the past ten years I’ve come across farmers who really believed in applications of sugar to reduce their pest populations. Being no research to my knowledge to prove it, I tucked the observation in the back of my head for future reference. With farmers looking to increase yields and looking to other farmers such as Kip Cullers for information, some of our on-farm research producers were curious about sugar applications in their operations with the hopes of increasing yield.
Nebraska On-Farm Research Corn Results
Using the application rates that Kip Cullers uses, one Clay County producer applied 3 lbs of sugar (purchased pallet of cane or beet sugar from the local grocery store) per 10 gallons of water at V7-V8 on corn in 2010-2011. Cullers also tanked mixed the sugar solution with a post-herbicide application like glyphosate but this producer didn’t do that. To simulate any affect of the water or driving through the field, he also drove through the untreated check spraying water only. Two years of research results showed no significant increase in yield. However, there was a noticeable difference in standability at harvest. This producer did not apply a foliar fungicide either year. When it came to harvest, this producer needed the reel in 2010 for the untreated check. Stalk rot ratings were taken using the pinch test two weeks prior to harvest. To him, the $1.25/acre of sugar was worth it to improve standability even if yield was not significantly improved. You can view the full research report here.

Several York County producers have also tried this with one producer finding a non-statistical 2 bu/ac yield difference with the check yielding better while the other producers found a statisically significant 2 bu/ac increase to the sugar treatment. Another producer in Hamilton County is testing this using the corn product he grows-using 1 qt of corn sugar (high fructose corn syrup) per 10 gal of water applied still at V7-v8.
In 2012, a small plot study was conducted at UNL’s South Central Ag Lab near Clay Center to determine any differences between sugar application, fungicide application, and untreated check in corn. All treatments were applied at R2. Because of the drought in 2012, there was minimal disease pressure, thus there were no significant differences between the three treatments regarding area under the disease progress curve. The untreated check did show the most stalk rot (via the push lodging test). The sugar application reduced the lodging rating by half and the fungicide application showed the lowest lodging rating. For yield, there were no significant yield differences with the untreated check yielding the highest followed by the fungicide and sugar applications. The entire study report can be found here.
In Soybeans we have had producers apply 3 lbs sugar in 10 gallons of water at R3 (beginning pod). In all years, there have been no significant differences in yield. Lodging ratings were not taken as that is more variety and water dependent.
Additional research…
has shown that application of sugar to crops increases the numbers of beneficial insects in those fields. South Dakota research entomologists showed that lady beetles benefited from a combination of prey and non-prey foods. In a follow-up study, these entomologists applied sugar sprays to soybeans and quantified the frequency of sugar feeding by analyzing the gut contents of common lady beetles in three states. They found all the tested lady beetles regularly consumed sugar-like nectar in soybean fields, even when it wasn’t applied as a supplement. They also found more lady beetles in the sugar treated plots compared to the untreated plots.
At this time we can’t explain the standability effect we’re seeing from our sugar applications to corn. Our hypothesis is that early application of sugar to corn is increasing beneficial microbes that may be keeping the exposed brace roots and stalks healthier. We hope to conduct more research in the future to answer this question.
In conclusion,
the application of sugar to corn and soybeans has not always shown increased yield. However, in nearly all of the corn studies, sugar treated plots have shown increased stalk strength at harvest. Research has also shown an increase in the number of beneficial insects in fields where sugar was applied. Further research is needed to understand the interactions aiding stalk strength in corn.
If you are interested in conducting on-farm research studies in your field, please contact any of our UNL Extension Educators or Specialists! You can also follow the conversations this year via our Facebook page and Twitter feed!
What do you think of sugar applications to crops? Have you tried this in the past and if so, what were your results?
Corn Planting Rate Research & Recs
Even with recent rain and snow events, the subsoil is still dry. You may be wondering,
“What should I do regarding corn planting rates in 2013?”
A few weeks ago, UNL Extension held our on-farm research meetings to share our 2012 Corn Planting Rate results for irrigated and dryland conditions. I always enjoy hearing our farmers share why they were interested in a certain trial and what they found out as a result.
Our farmers followed protocols of 28K, 32K, 36K, 40K (40,000 seeds/acre) or 30K, 34K, 38K, 42K/acre for irrigated production and 18K, 22K, 26K, and 30K for dryland production. 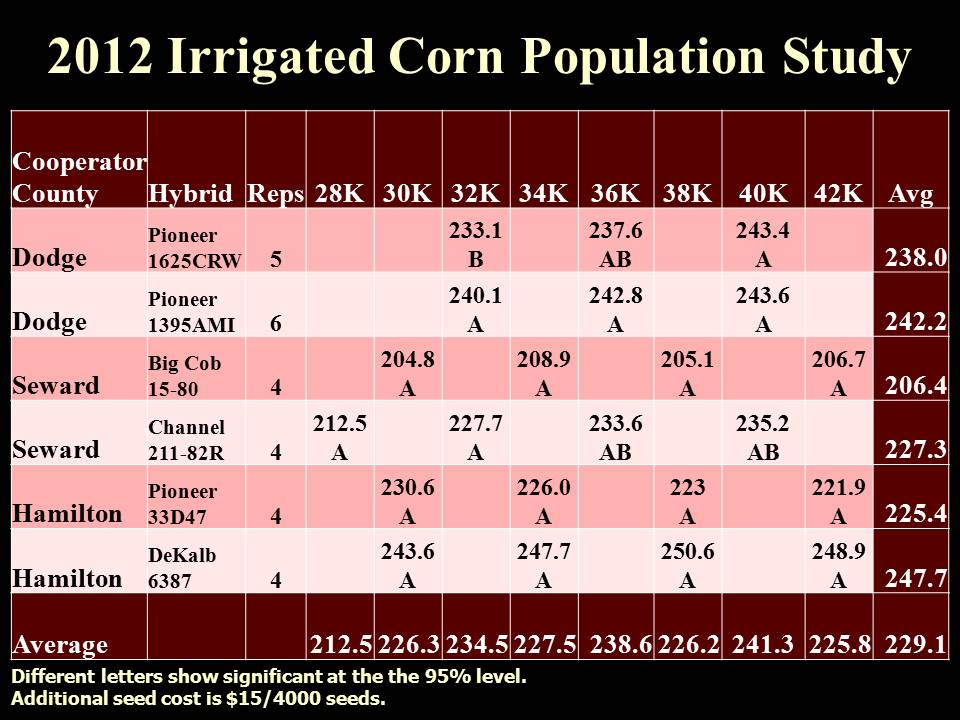
The results since 2010 continue to show us that each individual hybrid varies in its response to increasing populations; however, there is a general trend with newer hybrids that increasing population results in increased yields. Dr. Tom Hoegemeyer, UNL Agronomy Professor of Practice spoke about how our hybrids have genetically come so far in combating various stresses while maintaining yields. We know that many seed companies have conducted research to determine the population calibration curve for each hybrid to determine best recommendations for you. Thus, we’d recommend that you check with your seed dealer to determine which hybrid may fit best at which population for your operation.
Even with this data, you may question if that’s truly the best population for your field; that’s where on-farm research comes in! We recommend testing the recommended population against a higher and lower population with at least 4000 seeds/acre difference in planted population-whether irrigated or dryland. With today’s technologies, it’s not very difficult to test seeding rates for different hybrids for yourself!
So what rate should you plant this year? In the majority of our irrigated studies, economically, many hybrids maximized yields and economic returns between 32,000-36,0o0 seeds/acre. Again, this is very hybrid dependent so ask your seed dealer what he/she would recommend and test for yourself!
Regarding limited irrigation, UNL research has actually shown a negative effect of lost yield by backing off population too far in a dry year. 
Tom’s recommendation was for dryland in Eastern Nebraska, most hybrids even with the low soil moisture profile should be ok with planting 24,000-28,000 seeds/acre. I realize we have essentially no moisture in our profile. But taking probabilities of rainfall events, March-May is usually pretty good and we don’t want to short-change ourselves in yield by planting too low of populations. For Central into Western, NE, I feel 20,000-22,000 seeds/acre will work for many hybrids. Our genetics have come so far since we finished the last drought in 2007 and were planting 18,000 seeds/acre in dryland. We will just keep praying for rain and hope for the best next year! Ultimately, test this and your other on-farm questions for yourself to know what will work for your farm!
If you’re interested in conducting some seeding rate trials, please let anyone on our UNL On-Farm Research Team know! All our studies are posted on the CropWatch on-farm research page.
What planting rates are you considering for 2013?

