Category Archives: Crop Updates
On-farm Research
Wow, I’m sorry I haven’t published much the past two months! Much has happened though as we’re in the middle of winter Extension ag programming season! I love this time of year seeing farmers and ag industry reps-and just chatting about what happened last year and speculating about the upcoming season.
Many of you are also attending numerous meetings. You’re gathering information regarding products and production practices. You may be wondering “Will this work on my farm?” Why not go a step further and see for yourself? On-farm research is a great way to test these questions for yourself using your own equipment in your own fields!
UNL Extension has partnered with the Nebraska Corn Board and Nebraska Corn Growers to form the Nebraska On-farm Research Network. There are three main studies we are conducting state-wide: corn population, corn nutrient, and corn irrigation studies…but we are open to helping you design a valid research experiment for your field to test what you would like-and it can be for a crop other than corn.
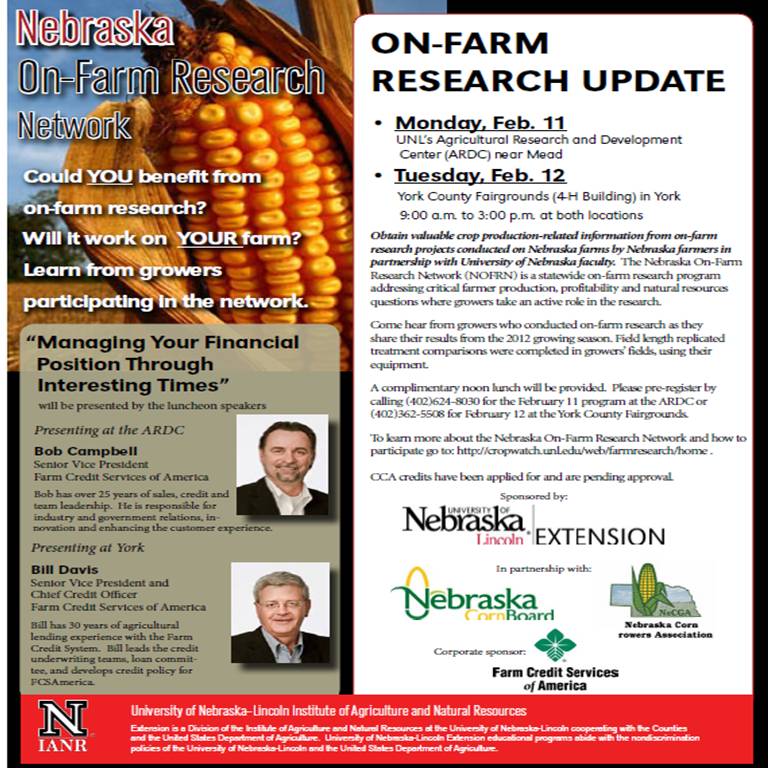
We have some upcoming opportunities for you to learn more. On February 11 and February 12 from 9:00 a.m.-3:00 p.m. at UNL’s Ag Research and Development Center near Mead and the York Co. Fairgrounds in York respectively, growers who conducted on-farm research in 2012 will be sharing their results; you can also learn more about conducting on-farm research in your own field. There is no charge for the meetings courtesy of the Farm Credit Services of America but we do need an RSVP for meal count and handouts. Please RSVP by calling (402)624-8030 for ARDC or (402)362-5508 for the program in York. I hope to see you at these meetings as well!

Research Fertilizer Options for Your Farm
November 1 is just around the corner-the beginning of when fall fertilizing occurs in this area of the State. Hopefully many of you have taken soil samples as excess nitrate is to be expected after this drought year. This is an excellent time to consider evaluating your nitrogen program by starting an on-farm research trial!
On-farm research is using your own equipment, in your own fields, over single or multiple growing seasons allowing you to determine the most economical, efficient, and sustainable practice for the production of irrigated and/or dryland crops on your own farm.
What are the soil fertility questions you have for your farm?
Right now, with fertilizing on producers’ minds, we’re hoping you will consider a soil fertility study. We have several example nutrient protocols including the UNL N fertility rate compared to +/- 30 lbs, and considerations for nitrogen timing studies such as pre-plant, sidedress, or fertigation. You can view all these plot designs by clicking on 2012 protocols. If you are planning on applying anhydrous this fall, be sure that the anhydrous strips are the correct width, as the corn must be harvested and weight determined in a correct manner next fall.
When designing a nitrogen comparison you need to remember nitrogen is a mobile nutrient and corn roots will spread laterally. Therefore, the width of the treatments must take this into account and compensate for it. If you have a 16 row nitrogen applicator and an 8 row corn head, you will need 32 rows of each nitrogen rate. Each 32 row strip must be repeated 4 times. At harvest, in each 32 row block, you must record and weigh the center 16 rows with two separate weights i.e. 8+8 . This is done for statistical analysis purposes. Without statistics, you cannot determine if differences between treatments is the result of the nitrogen rate or because of soil variability.
What’s in It for You?
On-farm research in your own fields allows you to find answers to the questions you may have. We all read articles or hear presentations about various practices and products. The question is “Will it work on my farm?“. That’s what on-farm research allows you to find out!
UNL Extension Educators and Specialists are here to help you design your on-farm research trials, help you with data collection, and will statistically analyze the data for you at the end of the season. Correct plot setup is critical to reduce any error in favoring one treatment over another (because we know fields are variable and some portions of the field will yield better than others). The statistical analysis is another tool which helps us determine how much any yield differences between treatments are due to the treatments themselves or to chance.
So if you have an idea you’d like to try, please contact any of the UNL Extension Educators or Specialists working with on-farm research! The Nebraska On-farm Research Effort is a partnership between the Nebraska Corn Board, Nebraska Corn Growers Association, and UNL Extension.
On-farm research may sound daunting, but today’s equipment makes it easier than ever. It does take a little extra time, but our farmers conducting on-farm research feel the value of knowing the results of a study on their own piece of ground make the effort worthwhile.
What are some on-farm research studies you would like to conduct this year or that you would like our group to consider?
Fall Fertilizing Considerations
With the early harvest and potential product discounts, producers may be considering fall fertilization soon. I can appreciate the reasons for it such as the product discounts, covering acres, and the fact that we don’t know what spring weather will bring in order to fertilize before planting.
At the same time applying nitrogen when a growing crop is not present allows for nutrient loss and we continue to see nitrates in groundwater increase in some areas. Check out the following Webcasts regarding research from UNL Soil Fertility Specialists as you consider nutrient application and the addition of nitrogen inhibitors.
Guidelines for Fall Fertilizing
If you do apply fertilizer in the fall, the Natural Resources District (NRD’s) have provided guidelines so please check specifically with them. Both UBBNRD and LBNRD have said no fall fertilization before November 1st and recommend no fall fertilization when soil temperatures are above 50°F. This is because the conversion of anhydrous ammonia is much slower once soil temperatures are consistently below 50°F. Please see the CropWatch Soil Temperature page for a map of current soil temperatures.
LBNRD also recommends but doesn’t require a nitrogen inhibitor placed with the anhydrous in the fall. No liquid or dry nitrogen fertilizer can be applied between November 1st and March 1st without receiving a fertilizer permit. With the fertilizer permit, producers will be required to put a nitrogen inhibitor in with their dry or liquid fertilizer.
Two exemptions are provided in the spreading of manure, sewage, and other by-products conducted in compliance with state laws and regulations, and the applications of pre-plant starter nitrogen to fall seeded crops, such as wheat.
A few other considerations from UNL Soil Fertility Specialists:
- Take soil samples as soil nitrates may be higher than normal this fall-particularly in dryland fields.
- Dry soils are difficult to sample and may affect results. Soil organic matter and soil nitrate results should be fine, but some soil pH and potassium may be affected by the dry conditions.
- Knife applications, including sealing of anhydrous ammonia injection tracks, also may be more difficult in dry soil conditions.
- Monitor rain and snow infiltration between now and the next growing season and make fertilizer adjustments next spring if excessive rain may have caused leaching.
Additional Resources
On Farm Research
 As harvest rolls to a close you most likely noticed some field variability or have some questions about how various products or production practices may work on your farm. Every year during the winter, UNL Extension educators share research conducted by your peers-other farmers-in their own fields and often those presentations are very interesting to our clientele.
With the advance of farming technologies, it’s easier than ever for more farmers to conduct research on their own farms. Depending on the study, there may be additional time involved, but overall, the farmers I’ve worked with who have conducted on-farm research say they obtained answers to their questions and the power was knowing it was research based on their own farm.
Last winter the two on-farm research groups in Nebraska combined to form the Nebraska On-Farm Research Network. With help from the Nebraska Corn Growers and Nebraska Corn Board, three State-wide studies were rolled out in addition to other studies that producers wanted to conduct on their own farms. That data is still being collected and analyzed right now and results will be presented this winter.
So as you think about the 2012 season, what are the questions you have? Consider working with your local Extension Educator to design a valid research-based experiment to answer the questions on your farm. To learn more, please check out the CropWatch on-farm research page.
What studies would you like to see our group research on-farm in 2013?
Cover Crops after Harvest
The past few months I’ve received several questions on cover crop options particularly after corn or soybean harvest.
Key highlights from this CropWatch article from  tend to use less water than what is lost to evaporation from bare soil (right) and they provide valuable organic matter as they break down in the soil. Photo via UNL CropWatch")
- Most cover crops need at least 30 days of growth to start being effective and many should have 60 days or more days to provide full benefits.
- Cover crop cocktails should be used as much as possible. The diversity in the mixture builds microbial and physical soil function and reduces the risk of failure.
- Check with your local USDA FSA Office and your crop insurance provider regarding the use of cover crops with your farm programs.
How many of you are planting cover crops this year? Which cover crops are you planting? What reasons did you decide to plant cover crops?
Wheat Planting Resources
This dry fall has raised questions about winter wheat planting…should I plant or delay? How much seed should I drop? My wheat has emerged but how do I assess my stands?
UNL Extension’s CropWatch newsletter has featured several wheat articles from Bob Klein, UNL Extension Cropping Systems Specialist and other Extension faculty. Since they’re on several different CropWatch release dates, I decided to put all the info. in one place for you. Hope this helps!
Recommendations to Compensate for Delayed Winter Wheat Seeding and Improve Yield Potential
For those who have waited to plant winter wheat, Bob Klein, UNL Extension Cropping Systems Specialist, says to increase wheat seeding rate 10-15 lbs per acre (150,000-225,000 seeds/acre) per week for every week delayed after the seeding rate for our area. Hessian fly free seeding dates range from September 25 for most of our area to September 28 in southern Nuckolls and most of Thayer Co.
For no-till, he recommends automatically increasing seeding rate an additional 50%. So if you’re a dryland no-till producer planting in October, he would recommend seeding 90 lbs to 120 lbs maximum of wheat seed. For irrigated wheat, start at at least 90 lbs/ac and increase 15-20 lbs/acre every week later than suggested seeding date but don’t exceed a maximum of 180 lbs/acre of seed.
Determining the Seeding Rate for Your Winter Wheat
A review of seedling rates vs. yield potential: On the average, there are 22 seeds per head and 5 heads per plant, or 110 seeds per plant. With an average seed size of 15,000 seeds per pound or 900,000 seeds per bushel, a pound of average-sized seed with 80 percent germination and emergence has a yield potential of approximately 1.5 bushels per acre. Seeding 40 lb of seed with a weight of 15,000 seed per pound has a yield potential of 60 bushels per acre.
Seedbed Conditions and Seeding Equipment Affect Timing of Wheat Seeding
Paul Jasa, UNL Extension Engineer says to make sure the drill is running lower in back than normal. Transfer more drill weight to the back of the drill and add extra weight to the drill. This will allow for penetration into dry, hard soil, forcing the seed into the soil and insuring seed-to-soil contact. Also, don’t seed wheat too shallow. When using disc drills, plant at a depth of 2 inches or more.
Additional Resources:
- Fertilizer Options for Dryland Wheat: Is Wait and See a Good Option?
- Grasshopper Management Considerations in Emergent Winter Wheat
- Use of Seed Treatment Fungicides to Improve Wheat
- Guides to Winter Wheat Variety Selection
- How Wheat Seeding Date Affects Yields
- Assessing Winter Wheat Stands and Estimating Yield Potential
Drought Dichotomy
We often say water is the lifeblood of agriculture. In a drought year like this, that truly is the case! A case study showing the impacts of irrigated agriculture to Nebraska this year can be found here.
Interesting is the dichotomy we’re experiencing in south central Nebraska where irrigated fields that were truly fully irrigated may have some of the best yields producers have experienced while in so many areas of the State-even neighbors a few miles away-are experiencing the worst year they have ever faced.
Dryland yields have been all over the board mostly depending on tillage type. Irrigated yields that were truly fully irrigated have been outstanding. Hybrid Maize predictions for our area had been good all year for fully irrigated corn and it looks like they are even better than the long-term average predictions!
Yet, as I drive around the countryside I can’t help but wonder at how many corn stalks are already being disked under. At a time when we’ve had several fires in our own State of Nebraska…when we have farmers and ranchers suffering trying to find forage for their livestock. We are so blessed to have irrigation here and that buffers our producers from weather extremes. But let’s not forget about the others who are hurting right now! I would ask our producers with irrigated fields to please consider leasing your stalks for grazing or baling them this year to help those in need of forage.
Research from UNL shows that cattle and cornstalks go well together.
Some producers worry about compaction but in a dry year like this, compaction is essentially a non-issue-at least this fall. UNL research from 1996-2011 showed the effects of fall and spring-grazing on subsequent corn and soybean yields. On average, yield of the following soybean crop was increased by about 2 bu/ac with fall-winter grazing, and 1.3 bu/ac with spring grazing, compared with no grazing of corn stalks. Yield of corn as the second crop after grazing was not significantly affected resulting in an average of 1-3 bu/ac yield increase depending on fall or spring grazing. Check out this study and all our resources to help with drought decisions.
An upcoming Webinar called Cornstalk Grazing-Understanding the Values to Cattle Producers and Corn Farmers scheduled for Oct. 2 from 12:30 to 1:10 p.m. will provide additional information. If you are unable to view it, it will be recorded with all our Beef Webinars.
So while irrigation has provided life and good yields to many producers’ crops in the area, let’s not forget about our neighbors who are less fortunate. Please consider leasing your corn stalks or baling them to help others in need of forage for their livestock! You can connect with other producers by checking out the Hay and Forage Hotline at 800-422-6692. This hotline lists hay and forage including cornstalks that is available via sale or donation.
Additional Resource: How much to charge for cornstalk grazing?
Harvest #Soybeans at 13%
In spite of green stems and even leaves on some plants, soybeans are surprisingly drier than what you may think. I’ve been hearing reports of  soybeans in the 7-10% moisture range already in spite of there also being some “lima beans” along with the low moisture beans at harvest.
Harvesting soybeans at 13% moisture is a combination of skill and maybe some luck. Why is 13% so critical? A standard bushel of soybeans weighs 60 lbs. and is 13% moisture. Often beans are delivered to the buyer at lower moisture than 13%. The difference between actual and desired moisture content will result in lost revenue to the grain producer. Here’s how the loss works based on UNL Extension’s “10 Easy Ways to boost profits up to $20/acre”:
- Since 13 percent of the weight is water, only 87 percent is dry matter. The dry matter in a standard bushel is 52.2 pounds and the remaining 7.8 pounds is water.
- If this bushel of soybeans is kept in an open basket and some moisture is allowed to evaporate, the net weight of beans would decrease. If the dry matter weight remains unchanged at the standard 52.2 pounds, the wet basis weight for any moisture content can be calculated.
- For example, a standard bushel at 13 percent moisture weighs 60 pounds. If the moisture content were reduced to 11 percent (89 percent dry matter), the wet basis weight per bushel of the soybeans would be 52.2 pounds of dry matter divided by .89=58.65 pounds. (1.35 pounds less than the standard 60 lb. weight of beans initially placed in the basket). For each 52.2 pounds of dry matter delivered at 11 percent moisture, you miss an opportunity to sell 1.35 pounds of water.
- It is standard practice for buyers to assume 60 pounds of soybeans constitutes a bushel when soybeans are at or below 13 percent moisture. When the beans are below 13 percent, the difference in water content is made up for by an equal number of pounds (wet basis) of soybeans.
- Assuming a 60 bushel per acre yield and selling price of $8.50 per bushel, the potential extra profit the producer could realize if the beans are harvested at 13 percent moisture instead of 11 percent is $11.48 per acre.
Rapid dry-down and difficulty harvesting green stems and pods are the most common reasons for harvesting at lower than standard moisture. The following practices can help producers maintain quality and expected moisture content.
- Adjust harvest practices. When harvesting tough or green stems, make combine adjustments and operate at slower speeds.
- Begin harvesting at 14 percent moisture. Try harvesting when some of the leaves are still dry on the plant; the beans may be drier than you think. Soybeans are fully mature and have stopped accumulating dry matter when 95 percent of the pods are at their mature tan color.
- Plan planting dates and variety selection to spread out plant maturity and harvest.
- Avoid harvest losses from shattering. Four to five beans on the ground per square foot can add up to one bushel per acre loss. Harvest at a slow pace and make adjustments to the combine to match conditions several times a day as conditions change.
Latest 2012 #Corn Yield Predictions
2012 Corn Yield Potential Forecast Based on Aug. 27 Hybrid-Maize Simulation: Irrigated corn yield potential is predicted to be 2-8% below long-term average, while dryland yield potential in much of the Corn Belt will be moderately to severely reduced, falling 22-67% below normal. Predictions are assuming no stress during pollination and fully irrigated fields with no equipment, disease, or insect problems.
|

Simulations were run for dryland corn in Iowa, Illinois, and South Dakota, and for both irrigated and dryland corn in Nebraska. Simulations were based on the typical planting date, hybrid relative maturity, plant population, and soil properties at each location. Underpinning data used in these simulations are provided in Table 1. To evaluate the impact on potential production at 12 sites across the Corn Belt (Figure 1), we used the Hybrid-Maize model to estimate end-of-season yield potential based on actual weather up to August 27, and historical long-term weather data to complete the season using data from each of the past 30 years. This approach gives a “real-time,” in-season estimate of expected yield potential (the median value shown in Table 1) depending on weather conditions from August 27 until the corn crop reaches maturity.
August 27 projections give a narrower range than our projections based on August 13 simulations, and, at some locations the crop reached blacklayer during the past week (Mead, Concord, O’Neill, and Nashua, Iowa). Projected yield potential since August 13 has not changed by more than 7% across all locations, except for the two locations in west central Illinois (Monmouth) and south central Illinois (Bondville) where predicted dryland yield has increased by 30% due to good rains and cooler weather. It should be noted, however, that if unusually hot, dry weather occurred during pollination at these Illinois locations, such a large yield improvement would not be expected due to reduced seed set. Still, projections of final yield potential are below the long-term average at all sites, under both irrigated and dryland conditions (Table 1).
The bottom line is that 2012 irrigated yields will be moderately lower than the long-term averages (2-8% below normal), while dryland corn yield potential in much of the Corn Belt will be moderately to severely reduced (22-67% below normal). It is important to keep in mind that yields can be even lower at places where both prolonged drought and high temperature stress at pollination have occurred. Also, greater field-scale variability is being observed this year in irrigated fields due to the inability of some irrigation systems to keep up with crop water use demand, problems with pivot irrigation nozzles and uneven watering, and additional stresses from insects and diseases. Such problems can contribute to reduced yields at irrigated sites of more than the 2-8% simulated by the model.There is a modest yield loss (5-8%) for locations in South Dakota (Brookings) and west central and north central Illinois (Monmouth and DeKalb) while a moderate yield loss of 22-28% is predicted for dryland corn in central and northeast Iowa (Gilbert and Nashua). Severe yield loss of 32-67% is projected for dryland corn in south central, eastern, and northeastern Nebraska (Clay Center, Mead, and Concord), northwest Iowa (Sutherland), and south central Illinois (Bondville) (Table 1). In contrast to large loss of yield potential in these dryland systems, the projected losses in yield potential at all irrigated sites are modest at about 2-3% in south central Nebraska (Clay Center, Holdrege), and 7-8% in east and northeast Nebraska (O’Neill, Concord, and Mead) (Table 1). Projected irrigated yield potential since August 13 has increased by about 3% due to cooler weather during the past two weeks.
Patricio Grassini, Research Associate Professor, Agronomy and Horticulture Department
Jenny Rees, UNL Extension Educator
Haishun Yang, Associate Professor, Agronomy and Horticulture Department
Kenneth G Cassman, Professor, Agronomy and Horticulture Department
Earlier Hybrid-Maize Predictions
| Table 1. 2012 In-season yield potential forecasts as of August 17 using UNL Hybrid-Maize Model | |||||||||
|
|
|||||||||
| Location, State | Water Regime | Soil Type¶& Initial Water |
Plant Pop.¶ (ac-1) |
Relative Maturity (days) |
Planting Date¶ | Long-term Yp (bu/ac)‡ |
2012 Forecasted Yp (bu/ac) | ||
| Median | |||||||||
|
|
|||||||||
| Holdrege, NE | Irrigated | Silt loam | 32.4k | 113 | April 27 | 248 |
243 | ||
| Clay Center, NE | Irrigated
Rainfed |
Silt clay loam
100% ASW |
32.4k
24.0k |
113 | April 23
April 23 |
250 146 |
242 98 |
||
| Mead, NE | Irrigated
Rainfed |
Silt clay loam
100% ASW |
32.4k
28.0k |
113 | April 30 | 240 160 |
224 53 |
||
| Concord, NE | Irrigated
Rainfed |
Silt loam
100% ASW |
32.4k
29.0k |
104 | May 3 | 235 154 |
218 90 |
||
| O’Neill, NE | Irrigated | Sandy loam
100% ASW |
32.4k | 106 | May 3 | 225 |
207 | ||
|
|
|||||||||
| Brookings, SD | Rainfed | Silt clay loam
100% ASW |
30.0k | 98 | May 4 | 120 |
110 | ||
|
|
|||||||||
| Sutherland, IA | Rainfed | Silt clay loam
100% ASW |
31.4k | 99 | May 1 | 168 |
104 | ||
| Gilbert, IA | Rainfed | Loam
100% ASW |
32.4k | 110 | April 26 | 200 |
145 |
||
| Nashua, IA | Rainfed | Loam
100% ASW |
32.4k | 99 | May 1 | 198 |
155 | ||
|
|
|||||||||
| Monmouth, IL | Rainfed | Silt loam
100% ASW |
32.4k | 112 | April 27 | 212 |
189 | ||
| DeKalb, IL | Rainfed | Silt clay loam
100% ASW |
32.4k | 111 | May 1 | 201 |
190 | ||
| Bondville, IL | Rainfed | Silt clay loam
100% ASW |
32.4k | 114 | April 20 | 197 |
134 | ||
|
|
|||||||||
| ¶ Simulations based on dominant soil series, average planting date, and plant population (PP) & relative maturity (RM) of most widespread hybrid at each location (Grassini et al., 2009).
‡ Average (20+ years) simulated yield potential (Yp). |
|||||||||

